Climate & Environment
Previously reported – January 2024
It’s official: 2023 was Earth’s warmest year in a century and a half, with temperatures breaking records month after month.
The numbers are in, and scientists can now confirm what month after month of extraordinary heat worldwide began signaling long ago. Last year was Earth’s warmest by far in a century and a half. Global temperatures started blowing past records midyear and didn’t stop. First, June was the planet’s warmest June on record. Then, July was the warmest July. And so on, all the way through December. Averaged across last year, temperatures worldwide were 1.48 degrees Celsius, or 2.66 Fahrenheit, higher than they were in the second half of the 19th century, the European Union climate monitor announced on Tuesday. That is warmer by a sizable margin than 2016, the previous hottest year. To climate scientists, it comes as no surprise that unabated emissions of greenhouse gases caused global warming to reach new highs. What researchers are still trying to understand is whether 2023 foretells many more years in which heat records are not merely broken but smashed. In other words, they are asking whether the numbers are a sign that the planet’s warming is accelerating. “The extremes we have observed over the last few months provide a dramatic testimony of how far we now are from the climate in which our civilization developed,” Carlo Buontempo, the director of the E.U.’s Copernicus Climate Change Service, said in a statement. Every tenth of a degree of global warming represents extra thermodynamic fuel that intensifies heat waves and storms, adds to rising seas and hastens the melting of glaciers and ice sheets. Those effects were on display last year. Hot weather baked Iran and China, Greece and Spain, Texas and the American South. Canada had its most destructive wildfire season on record by far, with more than 45 million acres burned. Less sea ice formed around the coasts of Antarctica, in both summer and winter, than ever measured. NASA, the National Oceanic and Atmospheric Administration and the research group Berkeley Earth are scheduled to release their own estimates of 2023 temperatures later this week. Each organization’s data sources, and analytical methods are somewhat different, though their results rarely diverge by much. Under the 2015 Paris Agreement, nations agreed to limit long-term global warming to 2 degrees Celsius, and, if possible, 1.5 degrees. At present rates of greenhouse gas emissions, it will only be a few years before the 1.5-degree goal is a lost cause, researchers say. Carbon dioxide and other greenhouse gases are the main driver of global warming. But last year several other natural and human-linked factors also helped boost temperatures. The 2022 eruption of an underwater volcano off the Pacific island nation of Tonga spewed vast amounts of water vapor into the atmosphere, helping trap more heat near Earth’s surface. Recent limits on sulfur pollution from ships brought down levels of aerosols, or tiny airborne particles that reflect solar radiation and help cool the planet. Another factor was El Niño, the recurrent shift in tropical Pacific weather patterns that began last year and is often linked with record-setting heat worldwide. And that contains a warning of potentially worse to come this year. The reason: In recent decades, very warm years have typically been ones that started in an El Niño state. But last year, the El Niño didn’t start until midyear — which suggests that El Niño wasn’t the main driver of the abnormal warmth at that point, said Emily J. Becker, a climate scientist at the University of Miami. It is also a strong sign that this year could be hotter than last. “It’s very, very likely to be top three, if not the record,” Dr. Becker said, referring to 2024. Scientists caution that a single year, even one as exceptional as 2023, can tell us only so much about how the planet’s long-term warming might be changing. But other signs suggest the world is heating up more quickly than before. About 90 percent of the energy trapped by greenhouse gases accumulates in the oceans, and scientists have found that the oceans’ uptake of heat has accelerated significantly since the 1990s. “If you look at that curve, it’s clearly not linear,” said Sarah Purkey, an oceanographer with the Scripps Institution of Oceanography at the University of California, San Diego. A group of researchers in France recently found that the Earth’s total heating — across oceans, land, air and ice — had been speeding up for even longer, since 1960. This broadly matches up with increases in carbon emissions and reductions in aerosols over the past few decades. But scientists will need to continue studying the data to understand whether other factors might be at work, too, said one of the researchers, Karina von Schuckmann, an oceanographer at Mercator Ocean International in Toulouse, France. “Something unusual is happening that we don’t understand,” Dr. von Schuckmann said.
Read more » click here
Scientists knew 2023’s heat would be historic — but not by this much
The year 2023 was the hottest in recorded human history, Europe’s top climate agency announced Tuesday, with blistering surface temperatures and torrid ocean conditions pushing the planet dangerously close to a long-feared warming threshold. According to new data from the Copernicus Climate Change Service, Earth’s average temperature last year was 1.48 degrees Celsius (2.66 degrees Fahrenheit) hotter than the preindustrial average, before humans began to warm the planet through fossil fuel burning and other polluting activities. Last year shattered the previous global temperature record by almost two-tenths of a degree — the largest jump scientists have ever observed. This year is predicted to be even hotter. By the end of January or February, the agency warned, the planet’s 12-month average temperature is likely to exceed 1.5 degrees Celsius (2.7 degrees Fahrenheit) above the preindustrial level — blasting past the world’s most ambitious climate goal. The announcement of a new temperature record comes as little surprise to scientists who have witnessed the past 12 months of raging wildfires, deadly ocean heat waves, cataclysmic flooding and a worrisome Antarctic thaw. A scorching summer and “gobsmacking” autumn temperature anomalies had all but guaranteed that 2023 would be a year for the history books. But the amount by which the previous record was broken shocked even climate experts. “I don’t think anybody was expecting anomalies as large as we have seen,” Copernicus director Carlo Buontempo said. “It was on the edge of what was plausible.” The staggering new statistics underscore how human-caused climate change has allowed regular planetary fluctuations to push temperatures into uncharted territory. Each of the past eight years was already among the eight warmest ever observed. Then, a complex and still somewhat mysterious host of climatic influences combined with human activities to push 2023 even hotter — ushering in an age of “global boiling,” in the words of United Nations Secretary General António Guterres. Unless nations transform their economies and rapidly transition away from polluting fuels, experts warn, this level of warming will unravel ecological webs and cause human-built systems to collapse.
A year that ‘doesn’t have an equivalent’
When ominous warmth first appeared in Earth’s oceans last spring, scientists said it was a likely sign that record global heat was imminent — but not until 2024. But as the planet transitioned into an El Niño climate pattern — characterized by warm Pacific Ocean waters — temperatures took a steeper jump. July and August were the two warmest months in the 173-year record Copernicus examined. As Antarctic sea ice dwindled and the planet’s hottest places flirted with conditions too extreme for people to survive, scientists speculated that 2023 would not only be the warmest on record — it might well exceed anything seen in the last 100,000 years. Analyses of fossils, ice cores and ocean sediments suggest that global temperatures haven’t been this high since before the last ice age, when Homo sapiens had just begun to migrate out of Africa and hippos roamed in what is now Germany. Autumn brought even greater departures from the norm. Temperatures in September were almost a full degree Celsius hotter than the average over the past 30 years, making it the most unusually warm month in Copernicus’s data set. And two days in November were, for the first time ever, more than 2 degrees Celsius (3.6 degrees Fahrenheit) hotter than the preindustrial average for those dates. “What we have seen in 2023 doesn’t have an equivalent,” Buontempo said. The record-setting conditions in 2023 were driven in part by unprecedented warmth in the oceans’ surface waters, Copernicus said. The agency measured marine heat waves from the Indian Ocean to the Gulf of Mexico. Parts of the Atlantic Ocean experienced temperatures 4 to 5 degrees Celsius (7.2 to 9 degrees Fahrenheit) above average — a level that the National Oceanic and Atmospheric Administration classifies as “beyond extreme.” While researchers have not yet determined the impacts on sea life, similar heat waves have caused massive harms to microorganisms at the base of the food web, bleached corals and fueled toxic algae blooms, she added. Though the oceans cover about two-thirds of Earth’s surface, scientists estimate they have absorbed about 90 percent of the extra warming from humans’ burning of fossil fuels and the greenhouse effect those emissions have in the atmosphere. “The ocean is our sentinel,” said Karina von Schuckmann, an oceanographer at the nonprofit Mercator Ocean International. The dramatic warming in the ocean is a clear signal of “how much the Earth is out of energy balance,” she added — with heat continuing to build faster than it can be released from the planet.
What drove the record warmth
Scientists are still disentangling the factors that made 2023 so unusual. The largest and most obvious is El Niño, the infamous global climate pattern that emerges a few times a decade and is known to boost average planetary temperatures by a few tenths of a degree Celsius, or as much as half a degree Fahrenheit. El Niño’s signature is a zone of warmer-than-normal waters in the central and eastern equatorial Pacific Ocean, which release vast amounts of heat and water vapor and trigger extreme weather patterns around the world. But El Niño alone cannot explain the extraordinary heat of the past 12 months, according to Copernicus. Because it wasn’t just the Pacific that exhibited dramatic warmth in 2023. Scientists also believe the Atlantic may have warmed as a result of weakened westerly winds, which tend to churn up waters and send surface warmth into deeper ocean layers. It could also have been the product of below-normal Saharan dust in the air; the particles normally act to block some sunlight from reaching the ocean surface. Around the world, in fact, there has been a decline in sun-blocking particles known as aerosols, in large part because of efforts to reduce air pollution. In recent years, shipping freighters have taken measures to reduce their emissions. Scientists have speculated the decline in aerosols may have allowed more sun to reach the oceans. And then there is the potential impact of a massive underwater volcanic eruption. When Hunga Tonga-Hunga Ha’apai blasted a plume 36 miles high in January 2022, scientists warned it released so much water vapor into the atmosphere, it could have a lingering effect for months, if not years, to come. NASA satellite data showed the volcano sent an unprecedented amount of water into the stratosphere — equal to 10 percent of the amount of water that was already contained in the second layer of Earth’s atmosphere. In the stratosphere, water vapor — like human-caused emissions of carbon dioxide — acts as a greenhouse gas, trapping heat like a blanket around the Earth. But it won’t be clear how much of a role each of those factors played until scientists can test each of those hypotheses. What is clear, scientists stress, is that the year’s extremes were only possible because they unfolded against the backdrop of human-caused climate change. The concentration of carbon dioxide in the atmosphere hit a record high of 419 parts per million in 2023, Copernicus said. And despite global pledges to cut down on methane — which traps 86 times as much heat as carbon dioxide over a short time scales — levels of that gas also reached new peaks. Only by reaching “net zero” — the point at which people stop adding additional greenhouse to the atmosphere — can humanity reverse Earth’s long-term warming trend, said Paulo Ceppi, a climate scientist at Imperial College London. “That is what the physical science tells us that we need to do,” Ceppi said.
What comes next
Almost half of all days in 2023 were 1.5 degrees Celsius warmer than the preindustrial average for that date, Copernicus said — giving the world a dangerous taste of a climate it had pledged to avoid. At the Paris climate conference in 2015, nations agreed to a stretch goal of “pursuing efforts to limit the temperature increase to 1.5C above preindustrial levels.” Three years later, a special report from the Intergovernmental Panel on Climate Change found that staying within this ambitious threshold could avoid many of the most disastrous consequences of warming — but it would require the world to almost halve greenhouse gas emissions in just over a decade. But emissions have continued to rise, and now the world appears poised on the brink of surpassing the Paris target. At least one climate science organization believes the barrier has already been crossed. Berkeley Earth said in December that 2023 is virtually certain to eclipse it, though its estimates of 19th century temperatures are slightly lower than those other climate scientists use. This doesn’t necessarily mean the world has officially surpassed the limit set in the Paris climate agreement in 2015. That benchmark will only be reached when temperatures remain 1.5 degrees Celsius above average over a period of at least 20 years. But scientists are already speculating that the planet could set another average temperature record in 2024. Some also say the latest spike in global temperatures is a sign the rate of climate change has accelerated. Whether or not 2023 surpasses the 1.5 degree limit, the year “has given us a glimpse of what 1.5 may look like,” Buontempo said. He hoped that the latest record allows that reality to set in — and spurs action. “As a society, we have to be better at using this knowledge,” Buontempo added, “because the future will not be like our past.”
Read more » click here
Previously reported – February 2024
World surpasses key warming threshold across an entire year for the first time
-
- Scientists on Thursday said the world surpassed a key warming threshold across an entire year for the first time on record.
- The European Union’s Copernicus Climate Change Service (C3S) said the global mean temperature for the 12-month period through to January was 1.52 degrees Celsius above the 1850-1900 pre-industrial average.
- “Rapid reductions in greenhouse gas emissions are the only way to stop global temperatures increasing,” Samantha Burgess, deputy director of C3S, said in a statement.
Scientists on Thursday said the world surpassed a key warming threshold across an entire year for the first time on record, calling to slash planet-warming greenhouse gas emissions. The European Union’s Copernicus Climate Change Service (C3S) said the global mean temperature for the 12-month period through to January was 1.52 degrees Celsius above the 1850-1900 pre-industrial average, and 0.64 degrees above the 1991-2020 average. The findings do not represent a break of the landmark Paris Agreement, which aims to “limit global warming to well below 2, preferably to 1.5 degrees Celsius, compared to pre-industrial levels” over the long term. But the EU’s climate monitor said the data reinforces the need to rapidly reduce greenhouse gas emissions in order to avoid the worst of what the climate crisis has in store. C3S also confirmed that the first month of 2024 was the warmest January on record, with an average surface temperature of 13.14 degrees Celsius — some 0.7 degrees Celsius above the 1991-2020 average and 0.12 degrees Celsius higher than the previous warmest January, logged in 2020. Each of the seven months prior to January also broke heat records for their respective time of the year. Scientists recently confirmed 2023 as the hottest year on record. “2024 starts with another record-breaking month — not only is it the warmest January on record but we have also just experienced a 12-month period of more than 1.5°C above the pre-industrial reference period,” Samantha Burgess, deputy director of C3S, said in a statement. “Rapid reductions in greenhouse gas emissions are the only way to stop global temperatures increasing.”
‘A rapidly shrinking window’
The data comes after repeated warnings that the world remains “massively off track” to limit global warming to 1.5 degrees Celsius. The 1.5 degrees Celsius threshold is recognized as a crucial long-term target because so-called tipping points become more likely beyond this level. If passed, tipping points can lead to dramatic shifts or potentially irreversible changes to some of Earth’s largest systems. Matt Patterson, a postdoctoral research assistant in atmospheric physics at the University of Oxford, described the findings of C3S as a “significant milestone,” but cautioned that they do not mean the Paris Agreement has failed. “A single year above the 1.5C threshold is not enough to breach the Paris climate agreement as the agreement concerns temperatures averaged over 20 to 30 years,” Patterson said. “However, exceeding 1.5C in one year underlines the rapidly shrinking window of time humanity has to make deep emissions cuts and avoid dangerous climate change.” The U.N. notes that the world has already warmed by around 1.1 degrees Celsius, fueling a series of extreme weather events around the world. Brian Hoskins, chair of the Grantham Institute at Imperial College London, said the C3S findings were a “stark warning of the urgency for the action that is required to limit climate change at anything like the Paris targets.”
Read more » click here
Previously reported – March 2024
Weirdly Warm Winter Has Climate Fingerprints All Over It, Study Says
Recent heat waves in cities worldwide have the hallmarks of global warming, researchers said. And last month was the hottest February on record.
Winter was weirdly warm for half the world’s population, driven in many places by the burning of fossil fuels, according to an analysis of temperature data from hundreds of locations worldwide. That aligns with the findings published late Wednesday by the European Union’s climate monitoring organization, Copernicus: The world as a whole experienced the hottest February on record, making it the ninth consecutive month of record temperatures. Even more startling, global ocean temperatures in February were at an all-time high for any time of year, according to Copernicus. Taken together, the two sets of figures offer a portrait of an unequivocally warming world that, combined with a natural El Niño weather pattern this year, has made winter unrecognizable in some places. The first analysis, conducted by Climate Central, an independent research group based in New Jersey, found that in several cities in North America, Europe and Asia, not only was winter unusually warm, but climate change played a distinctly recognizable role. Climate Central looked at anomalies in December and January temperature data in 678 cities worldwide and asked: How important are the fingerprints of climate change for these unusual temperatures? That is to say, its researchers tried to isolate the usual variability of the weather from the influence of climate change. “There’s the temperature,” said Andrew Pershing, Climate Central’s vice-president for science, “and then there’s our ability to really detect that climate signal in the data.” Cities in the Midwestern United States jumped out for experiencing an extraordinarily warm winter and for the influence of climate change, which is caused mainly by the burning of coal, oil and other fossil fuels that release greenhouse gases into the atmosphere. “Really off the charts,” Dr. Pershing said. “No ice on most of the great lakes. That’s remarkable.” Minneapolis, for instance, was nearly 5.6 degrees Celsius warmer than average between December and February. The fingerprints of climate change could be detected for 33 days, essentially a third of the winter season. Tehran was 4.2 degrees Celsius warmer on average during the same three-month period. The effects of human-made climate change could be detected over 68 days of winter. Milan’s winter average temperature was roughly 2 degrees Celsius higher, but there was a strong climate change signal over 55 days. Elsewhere, even though there were a few significantly hot days, winter average temperatures didn’t vary wildly, and the climate signal was less pronounced. The Climate Central report, also published Wednesday, concluded that 4.8 billion people worldwide “experienced at least one day of temperatures that would be virtually impossible without the influence of carbon pollution.” In some parts of the world, the unusually warm winter weather was overshadowed by other crises, such as war. Several cities in Ukraine were significantly warmer than usual, and there, too, were the fingerprints of climate change. Kyiv, for instance, was nearly 3 degrees Celsius warmer on average this winter, and climate change was seen to have played a role for 33 days. Likewise, in several cities of Iran, Iraq and Afghanistan. In the tropical belt, where it’s usually much hotter on average, climate signals are easier to detect, though temperature increases can be smaller. Jakarta and Kuala Lumpur for instance were barely 1 degree Celsius warmer on average. But the effects of climate change could be detected for nearly the entire three-month period. It’s not just individual cities that set records this winter. Globally, February 2024 was the warmest February on record, according to the Copernicus Climate Change Service. It was 1.77 degrees Celsius above the average February temperature in the recent preindustrial era from 1850-1900. This is the ninth month in a row to break the temperature record for that respective month. Taken together, the past 12 months have been the hottest 12 consecutive months on record: 1.56 degrees Celsius above the average from 1850-1900. “A year ago, the fact that the global temperature for a particular month would reach 1.5 degrees C above the pre-industrial level would have been considered exceptional,” said Julien Nicolas, a senior scientist at Copernicus, via email. Now, it’s happened repeatedly. This doesn’t mean we have exceeded the international Paris Agreement goal of stopping global warming at 1.5 degrees Celsius above the preindustrial temperature. For that to happen, the planet would need to be 1.5 degrees warmer for several years, long enough to reflect a more permanent change. For now, in the short term, the ocean has been particularly hot. The average global sea-surface temperature in February was the warmest recorded for any month, surpassing the previous record set in August 2023.
Read more » click here
The planet just shattered heat records for the ninth month in a row
Last month was the planet’s hottest February on record, marking the ninth month in a row that global records tumbled, according to new data from Copernicus, the European Union’s climate monitoring service. February was 1.77 degrees Celsius warmer than the average February in pre-industrial times, Copernicus found, and it capped off the hottest 12-month period in recorded history, at 1.56 degrees above pre-industrial levels. It’s yet another grim climate change milestone, as the long-term impacts of human-caused global warming are given a boost by El Niño, a natural climate fluctuation. “February joins the long streak of records of the last few months. As remarkable as this might appear, it is not really surprising as the continuous warming of the climate system inevitably leads to new temperature extremes,” Carlo Buontempo, director of Copernicus, said in a statement. Even in the context of back-to-back months of unprecedented temperatures, February has been extreme. Global temperatures in the first half of the month in particular were “exceptionally high,” according to the analysis. Four consecutive days, from February 8 to 11, were 2 degrees warmer than those same days pre-industrial times. Restricting global heating to well below 2 degrees was a centerpiece of the Paris Agreement that almost every country signed up to in 2015. While scientists are much more concerned with longer-term warming, these temporary breaches are a clear and alarming sign of accelerating heating. Global ocean temperatures were also off the charts last month, hitting 21.06 degrees — the highest average for any month on record, according to the Copernicus data, beating the previous record of 20.98 degrees set in August 2023. Experts have expressed shock at just how hot the oceans have been, especially the North Atlantic, which has set a new daily temperature record every day since March 5 last year, according to Brian McNoldy, a senior research associate at the University of Miami Rosenstiel School. “At times, the records have been broken by margins that are virtually statistically impossible,” McNoldy told CNN. Record ocean heat has significant global impacts. Not only is it dangerous for marine life but it also fuels extreme weather, including scorching heat waves, intense rainfall and ferocious hurricanes. The Copernicus data “tells a familiar story of warming temperatures and shifting patterns of weather,” said Hannah Cloke, a climate scientist and professor at the University of Reading in the UK. It is entirely consistent with what scientists have predicted would happen “as greenhouse gases continue to build up in our thin, life-giving atmosphere,” she told CNN. It provides yet more evidence that the world needs to reduce emissions drastically and immediately, Cloke said. If this evidence is ignored, Cloke added, “our children’s generation, and all those that follow, will be justified in pointing to the people who lived in 2024 and cursing our reckless stupidity.”
Read more » click here
Previously reported – April 2024
Earth sees hottest-ever March, the 10th record-breaking month in a row
The Earth just recorded its hottest March on record, the 10th month in a row to reach that feat, according to the European Union’s Copernicus Climate Change Service. Fueled by a mix of human-caused warming and the El Niño climate pattern, the all-time monthly highs were observed both in the air and in the ocean’s waters, the Copernicus report said. The heat over the past 12 months has pushed global average temperatures to an unprecedented 1.58 degrees Celsius (2.84 degrees Fahrenheit) warmer than preindustrial levels, and the hotter air over the Atlantic Ocean in particular could lead to an especially intense hurricane season, scientists warned. “It should be eye-catching — we are going toward uncharted territory,” said Gillian Galford, the lead of the Vermont Climate Assessment and a professor at the University of Vermont who reviewed the report. “It’s rather unusual we see such an increased temperature over months and seasons.” She added that the warmer waters in the Atlantic in particular can lead to larger storms and a more intense hurricane season. It could also lead, she said, to more storms dumping more water in places like Vermont in the northeastern United States, which saw intense flooding last summer. March’s average surface air temperature of 14.14 degrees Celsius (57.45 degrees Fahrenheit) was .1 degrees (.18 degrees Fahrenheit) warmer than the previous high set in March 2016. Copernicus found that the Antarctic sea ice extent was 20 percent below average after the planet experienced its warmest winter, defined as December through February. While experts say the 10 consecutive months reflect a broader trend that is likely to continue, they said it doesn’t suggest that every month will be record-breaking indefinitely. “But historic highs will probably continue in the months ahead,” said Samantha Burgess, deputy director of Copernicus. “Seasonal forecasts suggest spring and summer are likely to be warmer than average,” Burgess told The Washington Post. “The reality is unless we change our emissions dramatically, we’ll look back at 2023 and consider it a cool year, 10 to 20 years in the future.” The report comes two months after scientists found Earth’s 12-month average temperature for the first time breached 1.5 degrees Celsius above preindustrial levels, defined as the average temperatures between 1850 and 1900. Climate experts fear that catastrophic changes, like the collapse of critical ocean circulations, could occur should the Earth’s temperatures remain near or above that threshold for multiple years. In the 2016 Paris climate agreement, nations around the world agreed to keep global average temperatures from exceeding 2 degrees Celsius above preindustrial levels. The nearly 200 participating countries also agreed to “pursue efforts” to keep the multiyear averages below 1.5 degrees Celsius, which could allow for the survival of coral reefs and less deadly heat waves. But to do so, activists have noted that emissions need to be sharply cut by 2030. It’s unclear exactly what influence El Niño — the warming of the ocean surface in the central and eastern Pacific that tends to lead to warmer weather around the world — had in the record heat. But scientists say that 10 consecutive months of record temperatures suggest human-caused climate change played a role, noting that March’s broken record took place after El Niño peaked. Peter Huybers, a professor of earth and planetary sciences at Harvard University, said the records are not a “huge surprise” given the continued global greenhouse gas emissions. “It’s a bellwether whenever you break a record,” he said. “And we’re seeing those records in spades this year. But we’re exactly where we expected to be given those fundamentals.” He added that the Earth’s natural fluctuation, which results in some warmer years and some cooler years, could mean the streak eventually ends as El Niño weakens and is potentially replaced by La Niña, its opposite. But the long-term trends of unprecedented heat are likely to continue, which Burgess said could make it more difficult to predict how the climate will behave in the future — especially if a “tipping point” is reached. “Then we’ll need a lot more science and data to predict what could happen next,” she said.
Read more » click here
Previously reported – May 2024
A streak of record global heat nears one-year mark
April marked an 11th consecutive month of record global heat, the latest sign that humans are in uncharted climate territory. But there is reason to predict planetary temperatures could moderate soon, though they would remain far above old normals because of human-caused global warming. “If 2024 continues to follow its expected trajectory, global temperatures will fall out of record territory in the next month or two,” Zeke Hausfather, a climate scientist with the payments company Stripe, wrote in a newsletter. For now, the spate of unprecedented global heat continues to be felt around the world. April began with a heat wave across West Africa that was so intense, an analysis determined it would have been “virtually impossible” without the influence of human-caused planetary warming. The month ended with a stretch of record-setting heat across Southeast Asia, with temperatures surging well above 100 degrees and up to 120 degrees in some areas from India to the Philippines. But data suggests a diminishing trend in the margins by which average global temperatures are setting records. Hausfather called it “gobsmackingly bananas” when September set a new monthly average global temperature record by an unprecedented margin of 0.5 degrees Celsius. October set a record by a margin that was nearly as large and marked what was then the hottest 12-month period ever observed. Preliminary data shows last month was 0.1 to 0.2 degrees Celsius warmer than the next-hottest April, a significant margin but relatively closer to past observations. Climate scientists said it could be a sign that the surge of global warmth over the past year is beginning to wane, if only slightly. That is because of the imminent end of a historically strong episode of the planet-warming climate pattern El Niño, which began nearly a year ago. During El Niño, warm waters pool along the equator in the eastern and central Pacific Ocean, releasing heat into the atmosphere and triggering extreme heat waves, droughts and floods around the world. Climate models suggest that a rapid switch to the relative cooling influence of La Niña appears increasingly likely this summer or fall. During La Niña, cooler-than-average surface temperatures dominate the eastern and central equatorial Pacific. That could mean this year approaches but does not quite match the record average global heat observed on an annual basis in 2023, scientists said. Berkeley Earth climate scientist Robert Rohde recently predicted 2024 would end as the warmest or second-warmest year on record. Hausfather said that while the year has so far averaged about 1.7 degrees Celsius above preindustrial levels, before the influence of humans’ fossil fuel consumption began, it is likely to end about 1.5 degrees above that benchmark. How rapidly global temperatures moderate, if at all, will be key in gauging whether climate change is accelerating, NASA climate scientist Gavin Schmidt wrote in a Nature column in March. If La Niña develops and the record warmth does not moderate, it could signal that humans have “fundamentally altered” Earth’s climate system, he said.
Read more » click here
North Carolina map shows where state could be underwater from sea level rise
An interactive map shows how parts of North Carolina could be submerged in water as sea levels rise due to the effects of climate change.
The state faces particular risks because of its barrier islands, known as the Outer Banks, its extensive coastline and its low elevation. An interactive map shows how parts of North Carolina could be submerged in water as sea levels rise due to the effects of climate change. The state faces particular risks because of its barrier islands, known as the Outer Banks, its extensive coastline and its low elevation. The United Nations’ Intergovernmental Panel on Climate Change (IPCC) projects that by the year 2100, global sea levels will have risen by between 0.95 and 3.61 feet. However, it notes that a rise of around 6.6 feet “cannot be ruled out.” If sea levels rose by just 3 feet, parts of North Carolina’s barrier islands and coastal areas would be encroached by water, according to projections by the NOAA. If sea levels were to rise to 6 feet, nearly the entire counties of Dare, Hyde and Tyrrell would be submerged. If sea levels were to rise to that level, parts of Wilmington, one the state’s largest cities which is known for its historic downtown riverwalk, would also be affected, according to the map. Some coastal parts of North Carolina are already preparing for rising sea levels. The Outer Banks town of Nags Head has said it is factoring the issue into its zoning code, stormwater and flood and dune protection. The state has also widened its beaches by pumping sand from the ocean onto its shorelines. The rates by which sea levels might rise are at this point imprecise projections and could vary depending on what actions countries take to tackle climate change and slow the melting of ice caps. David Thornalley, a professor of ocean and climate science at University College London, previously noted that 2100 was only one lifespan away, and that significant sea rises “would happen if we didn’t take steps to reduce our GHG (greenhouse gas) emissions.” NOAA oceanographer William Sweet said in a previous email to Newsweek: “NOAA’s Sea Level Rise Viewer is a versatile mapping platform that provides insights on what lies in harm’s way—either from ongoing sea level rise or flooding from full-moon tides to hurricane storm surges. “Due to decades of sea level rise, high tides are drowning wetlands and routinely flooding U.S. coastal communities, disrupting commutes and commerce and requiring extensive upgrades to public works like storm and waste-water systems.”
Read more » click here
Previously reported – June 2024
A year of record global heat has pushed Earth closer to dangerous threshold
Temperatures surpassed the 1.5-degree Celsius warming threshold over the past year, and scientists warn they will again soon.
A streak of record-setting heat that began last summer has now persisted for an entire year across the globe, researchers announced Wednesday, pushing Earth closer to a dangerous threshold that the world’s nations have pledged not to cross. The data released by European climate scientists showed May was the 12th consecutive month during which average global temperatures surpassed all observations since 1850, and probably any extended period for more than 100,000 years. Over the past year, according to the European Union’s Copernicus Climate Change Service, global temperatures averaged 1.6 degrees Celsius (2.9 degrees Fahrenheit) above preindustrial levels. Under the landmark 2015 Paris agreement, the world’s leaders pledged to hold Earth’s temperature rise “to well below” 2 degrees C (3.6 degrees F) above pre-industrial levels and pursue efforts “to limit the temperature increase” to 1.5 degrees C above pre-industrial levels, to avert some of the worst effects of global warming. The fact that the planet surpassed 1.5 degrees C for one year does not amount to a permanent shift, but it comes as scientists are warning that it is likely to happen again — within a few years. The World Meteorological Organization said that it is highly likely that, for at least one calendar year in the next five, temperatures will exceed 1.5 degrees C above preindustrial levels once more. This unprecedented stretch of warmth, which has astonished scientists, prompted an urgent call by the United Nations to ban fossil fuel companies from advertising and encourage the public to stop using their products. “For the past year, every turn of the calendar has turned up the heat,” U.N. Secretary General António Guterres said in a special address in New York. “Our planet is trying to tell us something. But we don’t seem to be listening.” Researchers have linked the rise in temperatures to the El Niño climate pattern and decades of global heating from human emissions of greenhouse gases. A decade ago, scientists had estimated that the chances of the planet warming 1.5 degrees C by 2020 were nearly zero. Now, the probability of that happening by 2028 is an estimated 8 in 10.
A year-long surge of record heat
Global temperature records have been broken by significant margins since last June, as a burgeoning El Niño began releasing vast stores of heat from the Pacific Ocean. During the periodic climate pattern, warmer-than-average waters pool along the equator in the central and eastern Pacific, transferring warmth and moisture into the atmosphere and triggering extreme heat waves, floods and droughts around the world. In July, temperatures rose above the 1.5-degree C warming benchmark for an entire month, the first time that had happened. That warming trend then continued largely unabated. Global surface-air temperatures last month averaged 1.5 degrees C higher than the 1850-1900 global average, according to Copernicus. Carlo Buontempo, the Copernicus director, said that as remarkable as the trend is, “this string of hottest months will be remembered as comparatively cold” without action to reverse it. Emissions of carbon dioxide and other greenhouse gases from burning fossil fuels such as coal, oil and gas act to trap heat within the atmosphere, preventing it from escaping into space. A separate study published by a group of 57 scientists on Wednesday found that human activities were responsible for 92 percent of the warming observed in 2023, the planet’s hottest calendar year on record. It said the rate of warming in the past decade is “unprecedented in the instrumental record.” Data on global temperature records come from direct observations from ground sensors dating back nearly two centuries, satellite observations in more recent decades, and evidence from historical records and geologic analyses that go further back in time. While this data may not allow scientists to determine how hot it was on a single day or over a period of months many thousands of years ago, it does give confidence that the planet has not experienced such rapid and sustained warming since the end of the last ice age about 125,000 years ago.
Accelerating predictions of global warming
As warming has surged, projections of Earth’s temperature trajectory have accelerated. The latest version of a periodic report on near-term warming, also released Wednesday, shows it has become nearly a certainty that global temperatures will continue to cross into dangerous territory. At a sustained average of 1.5 degrees C above preindustrial levels, the U.N. Intergovernmental Panel on Climate Change has warned that weather will become so extreme, many people will struggle to adapt to it. “The difference between 1.5 and 2 degrees could be the difference between extinction and survival for some small island states and coastal communities,” Guterres said. Many climate scientists say that the Paris agreement’s target of no more than 1.5 C is already out of reach, though they stress that a single year above that level of warming does not mean the goal is lost. Scientists now estimate an 86 percent chance that at least one of the next five years also surpasses the record average annual temperature observed across the globe in 2023.
An increasingly dire call to action
Guterres used the data to stress the urgency of climate action ahead of a June meeting in Italy of the Group of Seven — the world’s wealthiest democracies — where matters of war and global trade are expected to take center stage. He repeated past calls for countries to stop investing in new coal power generation, and for developed countries to increase investment in clean energy and extreme weather adaptation, especially in poorer countries that have done the least to contribute to climate change and are feeling some of its worst effects. And Guterres is now demanding that all countries ban advertising from fossil fuel companies and that media and tech companies stop taking those companies’ ad dollars. Several cities and one country have already banned some fossil fuel advertising. Last month, the city council of Edinburgh, Scotland, voted to ban advertisements for fossil fuels as well as ads for SUVs and aviation. Amsterdam similarly has prohibited advertisements of gas-powered cars and airplane trips in the city’s center and subway stations. And after French President Emmanuel Macron asked 150 ordinary citizens to help with climate policymaking, his nation banned advertisements for coal, petroleum and hydrogen made from fossil fuels in 2022, though fossil fuel companies can still sponsor events. “We are playing Russian roulette with our planet,” Guterres said. “We need an exit ramp off the highway to climate hell.”
Read more » click here
Previously reported – July 2024
Sunday was the hottest day ever recorded on Earth, scientists say
Global temperatures Monday were the highest ever observed — breaking a record set only 24 hours earlier.
Global temperatures hit the highest levels in recorded history on Monday — breaking a record set only 24 hours earlier, according to preliminary data from Europe’s top climate monitor. The consecutive historic days — which came on the heels of 13 straight months of unprecedented temperatures and the hottest year scientists have ever seen — are yet another worrying sign of how human-caused climate change is pushing the planet to dangerous new extremes, scientists say. The results from the Copernicus Climate Change Service show the planet’s average temperature on July 22 was 17.15 degrees Celsius (62.87 degrees Fahrenheit) — exceeding the previous record, set on Sunday, by more than a tenth of a degree Fahrenheit. Even before Monday’s data had been analyzed, Copernicus director Carlo Buontempo said it was clear Earth was entering “uncharted territory.” “And as the climate keeps warming, we are bound to see records being broken in future months and years,” he said in a statement Monday. This week’s records come amid a hot streak of such scale and intensity scientists have struggled to fully explain it. Before July 2023, Earth’s daily average temperature record — set in August 2016 — was 16.8 degrees Celsius (62.24 degrees Fahrenheit). But in the past year, the global temperature has exceeded that old record on 58 days. “What is truly staggering is how large the difference is between the temperature of the last 13 months and the previous temperature records,” Buontempo said. The record could fall again within the coming days, Copernicus researchers wrote. But as the Northern Hemisphere summer comes to an end, and an expected La Niña weather pattern takes hold, the researchers expect Earth’s temperature to begin to cool. Scientists have been tracking global temperatures only for the past few centuries. Yet there is good reason to believe that Monday was the hottest day on Earth since the start of the last Ice Age more than 100,000 years ago. Research from paleoclimate scientists — who use tree rings, ice cores, lake sediments and other ancient material to understand past environments — suggests that recent heat would have been all but impossible over the last stretch of geologic time. The record-setting heat was felt on nearly every continent. Huge swaths of Asia sweltered amid scorching days and dangerously hot nights. Triple-digit temperatures in the western United States fueled out-of-control wildfires. Around much of Antarctica on Sunday, Copernicus data show, temperatures were as much as 12 degrees Celsius (22 degrees Fahrenheit) above normal. According to the National Centers for Environmental Information, 613 places around the planet saw record high daily temperatures in the last 7 days alone. The unrelenting heat has scientists increasingly convinced that this year could prove even hotter than last. In an analysis published Tuesday, climate scientist Zeke Hausfather estimated that 2024 has a 95 percent chance of setting a new annual heat record. The average temperature for the year is almost certain to exceed 1.5 degrees Celsius (2.7 Fahrenheit) above preindustrial levels — surpassing what scientists say is the threshold for tolerable warming. “It is troubling but not surprising that we are hitting record temperatures this year,” Andrew Pershing, vice president for science at the nonprofit Climate Central, wrote in an email. “We continue to add carbon pollution to the atmosphere, so global temperatures will continue to go up.”
Read more » click here
4 hottest days ever observed raise fears of a planet nearing ‘tipping points’
Since last July, Earth’s average temperature has been at least 1.5 degrees Celsius (2.7 degrees Fahrenheit) above preindustrial levels.
As global temperatures spiked to their highest levels in recorded history on Monday, ambulances were screaming through the streets of Tokyo, carrying scores of people who had collapsed amid an unrelenting heat wave. A monster typhoon was emerging from the scorching waters of the Pacific Ocean, which were several degrees warmer than normal. Thousands of vacationers fled the idyllic mountain town of Jasper, Canada ahead of a fast-moving wall of wildfire flames. By the end of the week — which saw the four hottest days ever observed by scientists — dozens had been killed in the raging floodwaters and massive mudslides triggered by Typhoon Gaemi. Half of Jasper was reduced to ash. And about 3.6 billion people around the planet had endured temperatures that would have been exceedingly rare in a world without burning fossil fuels and other human activities, according to an analysis by scientists at the group Climate Central. These extraordinary global temperatures marked the culmination of an unprecedented global hot streak that has stunned even researchers who spent their whole careers studying climate change. Since last July, Earth’s average temperature has consistently exceeded 1.5 degrees Celsius (2.7 degrees Fahrenheit) above preindustrial levels — a short-term breach of a threshold that scientists say cannot be crossed if the world hopes to avoid the worst consequences of planetary warming. This “taste” of a 1.5-degree world showed how the natural systems that humans depend on could buckle amid soaring temperatures, said Johan Rockström, director of the Potsdam Institute for Climate Impact Research in Germany. Forests showed less ability to pull carbon out of the atmosphere. Sea ice around Antarctica dwindled to near record lows. Coral bleaching became so extreme scientists had to change their scale for measuring it. Even as scientists forecast an end to the current record-breaking stretch, they warn it may prove difficult for parts of the planet to recover from the heat of the past year. “The extreme events that we are now experiencing are indications of the weakening resilience of these systems,” Rockström said. “We cannot risk pushing this any further.” This week’s broken records come on the heels of 13 straight months of unprecedented temperatures — fueled in part by the planet’s shift into an El Niño climate pattern, which tends to warm the oceans, as well as pollution from burning coal, oil, and gas. The warming neared its apex on Sunday, when data from the Copernicus Climate Change Service, the European climate monitor, showed the global average temperature edging out a record set a little over a year earlier. But the new benchmark stood for only 24 hours, with Monday hitting a historic 17.16 degrees Celsius (62.89 degrees Fahrenheit). Tuesday was the second hottest on record, and Wednesday tied Sunday as the third warmest. Though these numbers may not seem extreme, they are the average of thousands of data points taken from the Arctic to the South Pole, in places that are experiencing winter as well as those in the midst of summer. The preliminary data was generated using a sophisticated type of analysis that combines global weather observations with a state-of-the-art climate model — a method that outside researchers said Copernicus’s is highly reliable. The world’s oceans are also awash in historic heat. Copernicus data shows that the waters around Taiwan are 2 to 3 degrees Celsius (3.6 to 5.4 degrees Fahrenheit) hotter than normal, helping to fuel Typhoon Gaemi’s devastation. Research shows that higher ocean temperatures give more power to tropical cyclones, while a warmer atmosphere can hold more water — and thus produce more rain. Meanwhile, almost 2,000 weather stations around the planet notched new daily high temperature records over the last seven days, according to the National Centers for Environmental Information. Although scientists have not yet quantified the role of warming in all of this year’s extreme events, there is abundant evidence that heat waves, storms and fires are made more frequent and intense because of climate change. “We are running out of metaphors” to describe the unrelenting pace and scale at which the world is breaking records, Copernicus director Carlo Buontempo said. Sometimes, he said, he feels like the planet’s temperature is a helium balloon drifting inevitably upward. All he can do is stand below and say “Look, it is higher.” Scientists have estimated Earth’s average temperature based on observations dating to 1850, and now measure it by pulling data from more than 20,000 land-based stations as well as readings from ships and buoys around the globe. To convey the severity of Earth’s current heat, other researchers have turned to the planet’s past. By studying tree rings, lake sediments and other records of the ancient climate, paleoclimate researchers have determined that the world is likely now warmer than it has been in more than 100,000 years, since before the start of the last Ice Age. Humanity faces conditions unlike anything our species has known before. According to a Climate Central analysis of the five-day period ending Friday, almost half of the planet experienced at least one day of “exceptional heat” — temperatures that would have been rare or even impossible in a world without climate change. United Nations Secretary General António Guterres on Thursday called for improved warning systems, stronger worker protections and other policies to protect people from these scorching temperatures. “Extreme temperatures are no longer a one day, one week or one month phenomenon,” he said at a news conference. Buontempo expects that Earth’s record-breaking streak may soon end. The National Oceanic and Atmospheric Administration last month declared an official end to the El Niño, reflecting cooling conditions in the tropical Pacific Ocean. The end of summer in the Northern Hemisphere — where most of the world’s land is — also tends to bring down the planet’s overall temperature. Yet the unprecedented amount of heat-trapping carbon in Earth’s atmosphere — which is at its highest level in more than 3 million years — will mean that even without El Niño, the world remains perilously warm. Many researchers project that 2024 will end as the hottest year on record, exceeding the benchmark set in 2023. “The fluctuations we’re seeing are relatively modest on top of a very large, decades-long warming trend,” said climate scientist Kim Cobb, director of the Institute at Brown University for Environment and Society. “We’re dancing about a climate average that is very dangerous for communities and ecosystems around the world.” The worst of this week’s heat was concentrated in Antarctica, where temperatures were as much as 12 degrees Celsius (21.6 degrees Fahrenheit) above normal. Lynne Talley, a researcher at the Scripps Institution of Oceanography at the University of California at San Diego, said that anomaly is likely the product of strong winds pushing warm air onto the continent. Those conditions will make it more difficult for the ocean to freeze during what is usually the prime time for sea ice formation. “It seems like global warming is finally catching up with Antarctica, and that’s pretty frightening,” she said. The amount of sea ice around Antarctica is already at its second lowest level on record for this time of year — coming in just behind last July. After losing an unprecedented amount of ice cover during the 2023 melt season, Talley said, the region has been unable to rebound. To Rockström, the decline in Antarctic sea ice is one indication of how the recent global heat may be undermining the planet’s ability to buffer against some of climate change’s worst effects. Sea ice helps keep the poles cool by reflecting much of the sunlight that hits it back into space. When the ice melts, and the sun’s rays can reach the dark open ocean, their energy is absorbed by the planet. He also pointed to a new analysis that found the wilting and burning forests of the Amazon, Asia and Canada had lost much of their ability to absorb the excess carbon dioxide produced by human activities. The research, which has not yet been published in a peer-reviewed journal, focused on data from 2023 — meaning scientists are still unsure whether the finding represents a short-term blip or a more permanent shift. This year, the world’s forests are struggling once again. As of Wednesday, Canadian authorities were battling 310 uncontrolled wildfires, including the blaze that ravaged the town of Jasper. Trees turned to tinder by weeks of extreme heat are fueling a fast-moving fire in Northern California. The Amazon is bracing for a second consecutive year of an extreme drought that studies show is fueled by climate change. Robert Rohde, chief scientist for the climate data nonprofit Berkeley Earth, called these extreme events “suggestive” of what will happen to the planet if global temperatures consistently exceed 1.5 degrees Celsius of warming — something that researchers project will occur in the early 2030s. Studies indicate that crossing that threshold could trigger irreversible changes in major Earth systems: the collapse of the Greenland ice sheet, complete loss of tropical coral reefs, abrupt thawing of some permafrost. What the world is seeing now, Rockström said, is a “worrying sign of potentially approaching tipping points.” And as long as people continue adding carbon to the atmosphere, Cobb said, disasters will continue to happen and records will continue to fall. “It’s a Russian roulette wheel of climate devastation,” she said. “Whether it’s going to be your community in the line of a hurricane, or your city is going to have a heat wave. The threat is here and it’s now.”
Read more » click here
Previously reported – September 2024
Here’s what the hottest summer on Earth looked like
Amid an onslaught of lethal heat, surging disease and record-breaking storms, global temperatures this summer climbed to the highest levels on record, according to Europe’s top climate agency.
As floodwaters coursed through Texas and Taiwan, as mosquito-borne viruses spread across the Americas, as lethal heat struck down children on hikes and grandparents on pilgrimage, the world’s average temperature this summer soared to the highest level in recorded history, according to new data from Europe’s top climate agency. Global temperatures between June and August were 1.5 degrees Celsius (2.7 degrees Fahrenheit) above the preindustrial average, the Copernicus Climate Change Service said Friday — just edging out the record set last summer. The sweltering season reached its apex in late July, when Copernicus’s sophisticated temperature analysis program detected the four hottest days ever recorded. Meanwhile, temperatures for the year to date have far exceeded anything seen in the agency’s more than 80 years of recordkeeping, making it all but certain that 2024 will be the hottest year known to science. To Copernicus director Carlo Buontempo, the onslaught of broken records is sobering but not surprising. Humanity continues to burn fossil fuels at an ever-increasing pace, and the concentration of carbon dioxide in the atmosphere is higher than the world has seen in roughly 3 million years, according to the U.N. Intergovernmental Panel on Climate Change. “If you keep doing the same thing, you cannot expect to get any different result,” Buontempo said. “Unless we limit greenhouse gases, we will only see an exacerbation of these temperatures.” This summer came on the heels of an unprecedented year-long stretch in which Earth’s temperature repeatedly met or exceeded 1.5 degrees Celsius above the preindustrial average — a threshold scientists say the world cannot surpass if it hopes to avoid the worst consequences of climate change. The scorching conditions were the product of a complex cocktail of human-caused climate change and a strong El Niño event — a natural phenomenon characterized by warm temperatures in the Pacific Ocean. Though the El Niño was declared over in June, huge amounts of energy remained trapped in the Earth’s system, Buontempo said, fueling the summer’s extraordinary temperatures. The consequences were felt by people on every continent, from world-class athletes competing in the Paris Olympics to refugees fleeing wars. Wildfires fueled by heat and drought raged through the Brazilian Pantanal, a vital wetland known to store vast amounts of carbon. A turbocharged monsoon triggered landslides that killed hundreds of people in India’s Kerala state. The Atlantic Ocean saw its earliest Category 5 hurricane on record, while deadly floods have wreaked havoc from Italy to Pakistan to Nigeria to China. It was a summer of unrelenting humidity and heat too extreme for the human body to withstand. In June, at least 1,300 pilgrims visiting the Muslim holy city of Mecca died amid temperatures of 50 degrees Celsius (122 degrees Fahrenheit). In Mexico, 125 people were reported dead during a July streak of exceedingly hot nights that researchers say was made 200 times as likely by climate change. And in the Arctic archipelago of Svalbard, one of the world’s northernmost inhabited areas, August temperatures soared more than 2.5 degrees Celsius (4.5 degrees Fahrenheit) above the record. Nearly 7,000 weather stations in the United States broke daily temperature records between June 1 and Aug. 31, according to the National Oceanic and Atmospheric Administration. The heat has been blamed for dozens of fatalities, including those of a motorcyclist riding in Death Valley, an infant on a boat trip in Arizona and a California man who collapsed inside his un-air-conditioned home. In Maricopa County, Ariz. — one of the few jurisdictions to methodically track and report on the problem — officials have attributed at least 177 deaths this year to heat-related causes. Some of the most unusual heat this summer occurred in Antarctica, where plumes of warm air disrupted the deep freeze of the six-month polar night. Temperatures on the continent spiked about 28 degrees Celsius (50 degrees Fahrenheit) above usual levels, and the surrounding sea ice shrank to nearly unprecedented lows. The changes in Antarctica are especially eye-opening, Buontempo said, because the region has historically been isolated from the rest of the warming planet by a strong polar vortex and the swirling Southern Ocean. But since 2023, the extent of sea ice around Antarctica has been about 1 million to 2 million square kilometers less than in any year since satellite observations began. “This is very different from what we have seen in the past,” Buontempo said. “Even people working on sea ice are puzzled by the extent and the rapidity of the decline.” When Earth’s four hottest days were recorded in July, climate scientist Johan Rockström told The Washington Post that the planet was probably the warmest it has been since the last ice age began more than 100,000 years ago. Climate clues contained in ice cores, lake sediments and tree rings show that global temperatures are shifting out of the range they’ve occupied for most of human history. “We’re scratching 1.5 [degrees above preindustrial], and we’ve experienced how it hurts the economy, people and societies across the entire world,” said Rockström, director of the Potsdam Institute for Climate Impact Research. “But within five to 10 years … what we’re experiencing right now will be looked back upon as a mild year,” he added. “We are inevitably in for a rough ride.”
Read more » click here
Previously reported – November 2024
2024 Temperatures Are on Track for a Record High, Researchers Find
The new report also says that global warming has hit a threshold, at least temporarily, that countries had pledged to avoid.
This year will almost certainly be the hottest year on record, beating the high set in 2023, researchers announced on Wednesday. The assessment, by the Copernicus Climate Change Service, the European Union agency that monitors global warming, also forecast that 2024 would be the first calendar year in which global temperatures consistently rose 1.5 degrees Celsius above preindustrial levels. That’s the temperature threshold that countries agreed, in the Paris Agreement, that the planet should avoid crossing. Beyond that amount of warming, scientists say, the Earth will face irreversible damage. Greenhouse gas emissions from the burning of fossil fuels are dangerously heating up the planet, imperiling biodiversity, increasing sea level rise and drought and making extreme weather events more common and more destructive. “These type of events will get worse and they will get more frequent,” said Samantha Burgess, deputy director of Copernicus. Recent storms like Hurricanes Helene and Milton and the flooding in Spain demonstrate just how devastating weather intensified by warming can be. Still, it’s important to note that a single year above 1.5 degrees Celsius does not mean the Paris Agreement target has been missed. Under the terms of the pact, for that to happen, temperatures would have to stay at or above 1.5 degrees over a 20-year period. Each year has natural variability, so one year that’s warmer or cooler is not as important as the general trend of warming. It’s that signal, the steady crawl of record hot year after record hot year, that has alarmed experts. “It’s not good news, but it doesn’t mean we’ve broken the agreement,” Dr. Burgess said. If the trend continues for the next decade and greenhouses gas concentrations in the atmosphere remain at similar levels, that trajectory is more likely to be irreversible, she said. The Copernicus report comes the week before COP29, the annual United Nations climate talks at which countries come together to try to address climate change. This year, the meeting will be held in Baku, Azerbaijan, starting on Monday. A report issued by the United Nations last month found that the world’s current climate plans are inadequate, only providing a 2.6 percent reduction in greenhouse gas emissions by 2030 compared to 2019 levels. The Intergovernmental Panel on Climate Change has said that reduction needs to be an order of magnitude larger: at least a 43 percent reduction by 2030 and 60 percent by 2035. Even if the world stopped burning fossil fuels tomorrow, there would still be a lag in the reduction of global temperatures. That’s because it would take a while for the oceans and the land to absorb the carbon dioxide that’s already in the atmosphere. The Mediterranean would continue to warm. Droughts would drag on for many seasons. “The reality is, every fraction of a degree matters,” Dr. Burgess said. “The sooner globally we cut emissions, the sooner our climate will stabilize.” If President-elect Donald J. Trump withdraws the United States from the Paris accord, as he has promised and as he did during his first administration, it would be “very bad news,” according to Diana Urge-Vorsatz, a professor at Central European University and vice chairwoman of the Intergovernmental Panel on Climate Change, the U.N. body that provides governments with scientific information to develop climate policies. But she noted that during Mr. Trump’s last administration, cities, states and companies worked to overcome shortfalls by taking over climate leadership. “Let’s hope again,” Dr. Urge-Vorsatz said, “that other actors will step up and perhaps even take stronger action.”
Read more » click here
Science panel applies 2022 sea level report projections to NC
The science panel that advises the state Coastal Resources Commission is showing with a new report how the findings of a 2022 federal-level report projecting that sea levels will rise by more than a foot by 2050 apply to North Carolina. Released in mid-October, the “North Carolina 2024 Sea Level Rise Science Update” is the product of the science panel following the commission’s 2022 charge to present any new or significant data and research on sea level rise projections. The commission was put in place in 1974 when the North Carolina General Assembly adopted the Coastal Area Management Act, or CAMA. The 13-member commission designates areas of environmental concern, adopts rules and policies for coastal development within those areas, and certifies local land use plans. The state Department of Environmental Quality’s Division of Coastal Management staff enforces the commission’s rules. The U.S. Sea Level Rise and Coastal Flood Hazard Scenarios and Tools Interagency Task Force wrote “Global and Regional Sea Level Rise Scenarios for the United States,” that was published in February 2022 by the National Oceanic and Atmospheric Administration. Among the task force members are scientists from NOAA, NASA, the U.S. Geological Survey, Federal Emergency Management Agency, Army Corps of Engineers, Department of Defense and Environmental Protection Agency. “In recent years, confidence regarding the expected amount of sea level rise by 2050 has increased,” the science panel recaps from the 2022 technical report in its October 2024 update. Regardless of how much warming occurs by 2100, trajectories evaluated by the 2022 sea level rise technical report indicate sea level rise of 1 foot to 1.4 feet by 2050, relative to sea level in 2000. “The actual amount will depend on future greenhouse gas emissions, and how much ice is lost from the Greenland and Antarctic ice sheets,” the science panel continues in its update. “Projections for sea level rise beyond 2050 are less certain because they depend even more strongly on future greenhouse gas emissions and rate of ice loss from Greenland and Antarctica. However, rates of sea level rise are expected to further increase toward the latter half of this century.” On the science panel, Dr. Reide Corbett is the dean and executive director of the Integrated Coastal Programs at the Coastal Studies Institute on the East Carolina University Outer Banks Campus. He told Coastal Review that sea level rise projections continue to improve as new data becomes available and as the scientific community gains a better understanding of global processes changing sea level on different spatial and temporal scales. The state’s science panel used the best available and most recent data to provide this 2024 Sea Level Rise Update, Corbett continued, adding that “It is critical that our communities are working with the most informed projections as they develop actionable plans for building more resilience across our coast.” The strongest and most significant message Corbett said he sees coming from the 2024 update and other recent reports is that North Carolina must plan for at least a 1 foot rise in sea level by 2050. There is little deviation in this value whether projecting from tide gauges or using numerical models, Corbett added “This is a reality that we need to start planning for today,” he said. “A 1 foot rise in sea level will significantly increase the number of days coastal North Carolina will experience high tide flooding. Communities need to start building these challenges into their land use plans, stormwater plans, and communicating the risks to residents.” Division of Coastal Management Director Tancred Miller explained to Coastal Review that the science panel is defining sea level rise as an increase in the average height of the sea with respect to a specific reference. Relative sea level is the combination of three primary factors: the global sea level, vertical land movement and oceanographic effects. These parameters are usually discussed in terms of their rates of temporal change, commonly expressed in millimeters per year, he said. “Along the North Carolina coast, sea level is rising and the rate of rise varies depending on the location. There are two primary reasons for this variation along different parts of our coast: vertical land motion and the effects of ocean dynamics,” Miller continued. He explained that this recent update emphasizes that tide gauge observations and modeling for all scenarios are nearly the same out to 2050, “indicating we are solidly on track for at least one foot of sea level rise by 2050.” Miller noted that 2050 is just 25 years from now. “To prepare for this, requires community involvement, planning, mitigation, and adaptation to start now,” Miller said. To help better plan for sea level rise, the Coastal Resources Commission charged its science panel in 2022 with providing periodic updates to support what it called “informed planning and decision making.” The charge includes a request for the science panel to review every year any “new and significant scientific literature and studies that address the range of implications of sea level rise at the State, sub-regional, and local scales.” If there’s enough new information to warrant an update, the panel is to present these findings to the commission. Miller said for the science panel to follow through with the directive, the team of scientists held a series of meetings earlier this year to share and discuss any recent data related to sea level rise. “Given that the painstaking work of preparing sea level rise projections based on the latest science has already been carried out” by the task force, the science panel recaps the key messages detailed in the 2022 technical report. The science panel also gives a brief summary of the regional sea level rise projections most relevant to North Carolina and provides updated sea level rise projections and assessment of high-tide flooding frequencies for Duck, Beaufort and Wilmington, all based on data from the 2022 technical report. The science panel sent out a draft of the sea level rise science update for comment this spring. The document underwent a handful of changes based on public feedback, including the addition of a paragraph listing some of the key impacts of sea level rise, and adding the names of the different scenarios in the 2022 technical report — low, intermediate-low, intermediate, intermediate-high, and high — and referred to these throughout for clarity. “The five sea level rise scenarios span the range of sea level rise that can be expected under the emissions and warming scenarios considered in the Intergovernmental Panel on Climate Change Sixth Assessment Report,” or IPCC, the science panel states in its update. The IPCC was created by the United Nations to assess climate change-related science. “We also added text to explain how these scenarios relate to the emissions pathways and warming scenarios used in the Intergovernmental Panel on Climate Change report,” the new update continues. And provided more detail on the longer-term scenarios out to 2100. The science panel did note in its update that, although summarizing the latest science on how these impacts will affect the state “is well beyond the scope of the Sea Level Rise Update Charge to the Science Panel, we refer interested parties to the coastal aspects of the 2020 Climate Risk Assessment and Resilience Plan, and associated or similar documents (and updates), for a more comprehensive discussion of sea level rise impacts, based on the latest science, to facilitate effective adaptation and mitigation planning.” The first report the science panel, along with six additional contributors, issued was in March 2010 titled “North Carolina Sea Level Rise Assessment Report,” at the direction of the commission. The science panel recommended the report be reassessed every five years. In April 2012, the panel issued a follow-up addendum to the report in response to questions from the commission. That report was met with pushback from certain groups, resulting in a June 2012 law that put restrictions on how the sea level data was collated and used by state agencies and local governments. The panel released an update in 2015 of the 2010 report. “The next update was scheduled for 2020. However, due to the COVID pandemic, the 2020 update was postponed. In 2022, the CRC issued a revised charge to the science panel,” Miller said. The division continues to accept public comments on the newly released update. Send comments to DCMcomments@deq.nc.gov. List “2024 Sea Level Rise Science Update” in the subject line. “Comments regarding the final report simply serve as an opportunity for citizens to provide thoughts on the finished work and will be provided to the panel for review,” Miller said.
Read more » click here
Previously reported – December 2024
Why a two-year surge in global warmth is worrying scientists
Instead, global temperatures remain at near-record levels.
As 2023 came to a close, scientists had hoped that a stretch of record heat that emerged across the planet might finally begin to subside this year. It seemed likely that temporary conditions, including an El Niño climate pattern that has always been known to boost average global temperatures, would give way to let Earth cool down. That didn’t happen. Instead, global temperatures remain at near-record levels. After 2023 ended up the warmest year in human history by far, 2024 is almost certain to be even warmer. Now, some scientists say this could indicate fundamental changes are happening to the global climate that are raising temperatures faster than anticipated. “This shifts the odds towards probably more warming in the pipeline,” said Helge Goessling, a climate physicist at the Alfred Wegener Institute in Germany. One or two years of such heat, however extraordinary, doesn’t alone mean that the warming trajectory is hastening. Scientists are exploring a number of theories for why the heat is been so persistent. The biggest factor, they agree, is that the world’s oceans remain extraordinarily warm, far beyond what is usual — warmth that drives the temperature on land up as well. This could prove to be a temporary phenomenon, just an unlucky two years, and could reverse. “Temperatures could start plummeting in the next few months and we’d say it was just internal variability. I don’t think we can rule that out yet,” said Zeke Hausfather, a climate scientist at Berkeley Earth. But he added, “I think signs are certainly pointing toward fairly persistent warmth.” But some scientists are worried the oceans have become so warm that they won’t cool down as much as they historically have, perhaps contributing to a feedback loop that will accelerate climate change. “The global ocean is warming relentlessly year after year and is the best single indicator that the planet is warming,” said Kevin Trenberth, a distinguished scholar with the National Center for Atmospheric Research. Other factors are temporary, even if they leave the world a bit hotter. One important one, scientists say, is that years of efforts to clean up air pollutants are having an unintended consequence — removing a layer in the atmosphere that was reflecting some of the sun’s heat back into space. Whatever the mix of factors or how long they last, scientists say the lack of clear explanation lowers their confidence that climate change will follow the established pattern that models have predicted. “We can’t rule out eventually much bigger changes,” Hausfather said. “The more we research climate change, the more we learn that uncertainty isn’t our friend.” Experts had been counting on the end of El Niño to help reverse the trend. The routine global climate pattern, driven by a pool of warmer-than-normal waters across the Pacific, peaked last winter. Usually about five months after El Niño peaks, global average temperatures start to cool down. Often, that’s because El Niño is quickly replaced with La Niña. Under this pattern, the same strip of Pacific waters become colder than normal, creating a larger cooling effect on the planet. But La Niña hasn’t materialized as scientists predicted it would, either. That leaves the world waiting for relief as it confronts what is forecast to be its first year above a long-feared threshold of planetary warming: average global temperatures 1.5 degrees Celsius warmer than they were two centuries ago, before humans started burning vast amounts of fossil fuels. (Formally crossing this threshold requires at least several years above it.) The year 2023 is the current warmest year on record at 1.48 degrees Celsius above the preindustrial average. However, 2024 is expected to be at least 1.55 degrees, breaking the record set the year before. Last year’s record was further above the expected track of global warming than scientists had ever seen, by a margin of more than three tenths of a degree. This year, that margin is expected to be even larger. While changes in temperatures of a degree or less may seem small, they can have large effects, Trenberth said. Like “the straw that breaks the camel’s back,” he said. That includes increasing heat and humidity extremes that are life-threatening, changing ocean heat patterns that could alter critical fisheries, and melting glaciers whose freshwater resources are key to energy generation. And scientists say if the temperature benchmarks are passed for multiple years at time, storms, floods and droughts will increase in intensity, too, with a host of domino effects.
Trouble with record warm waters
Compared to past years when El Niño has faded, the current conditions are unlike any seen before. A look at sea surface temperatures following three major El Niño years — 2024, 1998 and 1983 — reveal that a La Niña-like pattern was evident in all three years, with a patch of cooler than average conditions emerging in the equatorial Pacific Ocean. But in 2024, the patch was narrow, unimpressive and dwarfed by warmer than average seas that cover most of the planet, including parts of every ocean basin. Known as marine heat waves, these expansive blobs of unusual oceanic heat are typically defined as seas being much warmer than average, in the highest 10 percent of historical observations, across a wide area for a prolonged period. Strong to severe marine heat waves are occurring in the Atlantic, much of the Pacific, the western and eastern Indian Ocean, and in the Mediterranean Sea. In October, ocean temperatures at that high threshold covered more than a third of the planet. On the other end, less than 1 percent of the planet had ocean temperatures in the lowest 10 percent of historical values. Warm and cold ocean temperature extremes should more closely offset each other. But what’s happening is a clear demonstration that oceans, where heat accumulates fastest, are absorbing most of Earth’s energy imbalance. Warm extremes are greatly exceeding cold ones. That’s a problem because what happens in the ocean doesn’t stay in the ocean. Because ocean water covers more than 70 percent of Earth, what happens there is critically important to temperatures and humidity on land, with coastal heat waves sometimes fueling terrestrial ones. Weather systems can sometimes linger, producing persistent sunny and wind-free days and bringing ideal conditions for marine heat wave development. These systems can sometimes straddle the land and the ocean, leading to a connected heat wave and transporting humidity. Trenberth said increasing heat in the oceans, particularly the upper 1,000 feet, is a major factor in the relentless increases in average surface temperatures around the world. And changes in ocean heat content can affect not just air temperatures, but sea ice, the energy available to storms and water cycles across the planet.
Factors that could trigger changes in global heat
Research has begun to unpack what else may be triggering such changes in global heat. One recent study found that a reduction in air pollution over the world’s oceans may have contributed to 20 to 30 percent of the warming seen over the North Atlantic and North Pacific, said Andrew Gettelman, a scientist at the Pacific Northwest National Laboratory and the study’s lead author. Restrictions on sulfur content in the fuels used by shipping liners, put in place in 2020, have dramatically reduced concentrations of sulfur dioxide particles that tend to encourage cloud formation. Though it means lower pollution levels, with fewer clouds, more solar radiation is hitting the oceans and warming them. A study released Tuesday found that a decline in cloud cover likely contributed to perhaps 0.2 degrees Celsius in previously unexplained warming that hit the planet last year. Goessling and colleagues think that was the product of cleaner shipping emissions, as well as a positive feedback loop in which warming close to Earth’s surface leads to reduced cloud cover, which leads to even more warming. The study found that in 2023, planetary albedo — the amount of sunlight reflected back into space by light-colored surfaces including clouds, snow and ice cover — may have been at its lowest since at least 1940. There have also been questions about the roles other factors may be playing, such as an increase in stratospheric water vapor after a 2022 volcanic eruption. But Earth’s systems are so complex that it’s been impossible to parse what exactly is happening to allow the surge in global temperatures to persist for so long. “Is this just a blip, or is this actually an acceleration of the warming?” Gettelman said. “That’s the thing everyone is trying to understand right now.”
What happens next?
This year is widely expected to be the warmest year on record, driven largely by the huge stores of ocean heat. And for now, seasonal model guidance keeps the foot on the accelerator into early 2025, as far as widespread warmer than average seas go. Because of record ocean heat and global temperatures, atmospheric circulation patterns, jet streams and storm tracks across the planet will change. Temperature records will continue to be set. How big these changes are partly depending on how much warming occurs in the year ahead. But that is unclear because the cooling that usually follows El Niño still hasn’t arrived. It’s possible that normal planetary variations are playing a bigger role than scientists expect and that temperatures could soon begin to drop, said Hausfather, who also works for the payments company Stripe. Even without the cooling influence of a La Niña, a stretch under neutral conditions, with neither a La Niña nor an El Niño, should mean some decline in global average temperatures, he said. At the same time, if this year’s unusual planetary warmth doesn’t slow down into 2025, there would be nothing to prevent the next El Niño from sending global temperatures soaring — the starting point for the next El Niño would be that much higher. Whether that happens later in 2025 remains to be seen. But the lack of clarity isn’t a promising sign when some of the most plausible explanations allow for the most extreme global warming scenarios, Hausfather said. “The fact that we don’t know the answer here is not necessarily comforting to us,” he said.
Read more » click here
Warming oceans made every 2024 hurricane stronger study says
“Through record-breaking ocean warming, human carbon pollution is worsening hurricane catastrophes in our communities.” – Dr. Daniel Gilford, climate scientist
With the official end of the 2024 hurricane season on Nov. 30, a new study has found that climate change supercharged 2024’s hurricanes and tropical storms − including Tropical Storm Helene that devastated Western North Carolina − and made them on average one category stronger than they normally would have been. The report by Climate Central, a nonprofit climate research group, builds on research looking at storms between 2019 and 2023 that found 30 hurricanes were more intense than they would have normally been due to sea surface temperatures made hotter by global warming. For the 2024 season, the Climate Central analysis found that maximum wind speeds for all eleven hurricanes to form so far were increased by 9 to 28 miles per hour. That included pushing Hurricanes Beryl and Milton to become Category 5 monsters, storms that otherwise wouldn’t have reached that level of intensity on the Saffir-Simpson Hurricane Wind Scale. Water temperatures in the Atlantic and Gulf of Mexico were at or above record levels for much of hurricane season, allowing tropical weather systems to suck in more fuel and turbocharge themselves into super storms. Hurricane Milton, for example, rapidly intensified by 95 mph in just 24 hours, faster than any other storm in the Gulf of Mexico, according to the National Hurricane Center. “Every hurricane in 2024 was stronger than it would have been 100 years ago,” Dr. Daniel Gilford, climate scientist at Climate Central and lead author of the study, said in a release. “Through record-breaking ocean warming, human carbon pollution is worsening hurricane catastrophes in our communities.” Helene’s wind speeds were made about 13 mph more intense because of climate change. In late September Helene ripped through Florida’s northern Gulf Coast before tearing through Georgia, South Carolina and into Western North Carolina, where it caused massive flooding, washing away roads, bridges and in some cases whole towns. The deadly storm killed more than 100 people in the Tar Heel State and caused an estimated $53 billion in damages.
Increased risk, increased costs
The new report adds to the mountain of evidence that human-induced warming of the planet through the pumping of greenhouse gases into the atmosphere is having profound impacts on the world’s weather, including the power, size and deadly impact of hurricanes. The increased threat from tropical weather systems has seen scientists and some political officials rushing to raise the alarm and hasten communities, especially along the coast, to become more resilient and better prepared for when − not if − one of these superstorms comes calling. Researchers also are warning that it isn’t just the storm’s winds that are being turbocharged by our warming climate. Helene dropped more than 30 inches of rain on parts of Western North Carolina, while an unnamed storm off the Cape Fear coast in mid-September that surprised local officials dumped more than 20 inches of rain on parts of New Hanover and Brunswick counties. The rising temperatures also are impacting sea levels, as warming waters mean ice in Greenland and Antarctica is melting more quickly than originally forecast. In a recent sea-level rise update report, the N.C. Coastal Resources Commission Science Panel said the evidence is becoming increasingly clear that the seas are rising, faster than originally thought in some cases, and that the trend will accelerate in the coming decades. The state’s top committee of coastal experts said North Carolina and coastal communities needs to plan to deal with at least 1 foot of sea-level rise compared to 2000 by 2050. An additional foot or more of sea-level rise, depending on how successful efforts are to slow the planet’s warming trend in coming decades, could easily occur before 2100. Some beachfront communities, like Rodanthe on the Outer Banks and North Topsail Beach on Topsail Island, are already facing severe erosion woes that threaten to accelerate more and more homes facing the threat of collapsing into the ocean, while communities like Carolina Beach struggle with tidal flooding that’s becoming increasingly common even without storms or King Tides. The private sector also is responding to concerns that climate change is making weather patterns more unpredictable, with some insurance companies either completely pulling out of states like Florida and Louisiana that have seen several direct hurricane hits in recent years or dramatically increasing homeowner rates to cover their potential risk of massive payouts if a big storm does hit. In North Carolina, the insurance industry is seeking to raise homeowner insurance premiums by 42% statewide and a staggering 99% in beach and coastal areas around Wilmington, citing the increased threat and uncertainty brought on by climate change as a primary driver. State regulators have challenged the proposal, and a decision made by N.C. Insurance Commissioner Mike Causey − which could be appealed by the insurance companies − is expected in the coming weeks. The National Flood Insurance Program, run by the federal government, also is pushing to significantly increase the prices it charges property owners as more areas are found to be either in floodplains or susceptible to massive rainfall events.
Read more » click here
Previously reported – January 2025
2024 Brought the World to a Dangerous Warming Threshold. Now What?
Global temperatures last year crept past a key goal, raising questions about how much nations can stop the planet from heating up further.
At the stroke of midnight on Dec. 31, Earth finished up its hottest year in recorded history, scientists said on Friday. The previous hottest year was 2023. And the next one will be upon us before long: By continuing to burn huge amounts of coal, oil and gas, humankind has all but guaranteed it. The planet’s record-high average temperature last year reflected the weekslong, 104-degree-Fahrenheit spring heat waves that shuttered schools in Bangladesh and India. It reflected the effects of the bathtub-warm ocean waters that supercharged hurricanes in the Gulf of Mexico and cyclones in the Philippines. And it reflected the roasting summer and fall conditions that primed Los Angeles this week for the most destructive wildfires in its history. “We are facing a very new climate and new challenges, challenges that our society is not prepared for,” said Carlo Buontempo, director of the Copernicus Climate Change Service, the European Union monitoring agency. But even within this progression of warmer years and ever-intensifying risks to homes, communities and the environment, 2024 stood out in another unwelcome way. According to Copernicus, it was the first year in which global temperatures averaged more than 1.5 degrees Celsius, or 2.7 degrees Fahrenheit, above those the planet experienced at the start of the industrial age. For the past decade, the world has sought to avoid crossing this dangerous threshold. Nations enshrined the goal in the 2015 Paris agreement to fight climate change. “Keep 1.5 alive” was the mantra at United Nations summits. Yet here we are. Global temperatures will fluctuate somewhat, as they always do, which is why scientists often look at warming averaged over longer periods, not just a single year. But even by that standard, staying below 1.5 degrees looks increasingly unattainable, according to researchers who have run the numbers. Globally, despite hundreds of billions of dollars invested in clean-energy technologies, carbon dioxide emissions hit a record in 2024 and show no signs of dropping. One recent study published in the journal Nature concluded that the absolute best humanity can now hope for is around 1.6 degrees of warming. To achieve it, nations would need to start slashing emissions at a pace that would strain political, social and economic feasibility. “It was guaranteed we’d get to this point where the gap between reality and the trajectory we needed for 1.5 degrees was so big it was ridiculous,” said David Victor, a professor of public policy at the University of California, San Diego. The question now is what, if anything, should replace 1.5 as a lodestar for nations’ climate aspirations. “These top-level goals are at best a compass,” Dr. Victor said. “They’re a reminder that if we don’t do more, we’re in for significant climate impacts.” The 1.5-degree threshold was never the difference between safety and ruin, between hope and despair. It was a number negotiated by governments trying to answer a big question: What’s the highest global temperature increase — and the associated level of dangers, whether heat waves or wildfires or melting glaciers — that our societies should strive to avoid? The result, as codified in the Paris agreement, was that nations would aspire to hold warming to “well below” 2 degrees Celsius while “pursuing efforts” to limit it to 1.5 degrees. Even at the time, some experts called the latter goal unrealistic, because it required such deep and rapid emissions cuts. Still, the United States, the European Union and other governments adopted it as a guidepost for climate policy. Christoph Bertram, an associate research professor at the University of Maryland’s Center for Global Sustainability, said the urgency of the 1.5 target spurred companies of all kinds — automakers, cement manufacturers, electric utilities — to start thinking hard about what it would mean to zero out their emissions by midcentury. “I do think that has led to some serious action,” Dr. Bertram said. But the high aspiration of the 1.5 target also exposed deep fault lines among nations. China and India never backed the goal, since it required them to curb their use of coal, gas and oil at a pace they said would hamstring their development. Rich countries that were struggling to cut their own emissions began choking off funding in the developing world for fossil-fuel projects that were economically beneficial. Some low-income countries felt it was deeply unfair to ask them to sacrifice for the climate given that it was wealthy nations — and not them — that had produced most of the greenhouse gases now warming the world. “The 1.5-degree target has created a lot of tension between rich and poor countries,” said Vijaya Ramachandran, director for energy and development at the Breakthrough Institute, an environmental research organization. Costa Samaras, an environmental-engineering professor at Carnegie Mellon University, compared the warming goals to health officials’ guidelines on, say, cholesterol. “We don’t set health targets on what’s realistic or what’s possible,” Dr. Samaras said. “We say, ‘This is what’s good for you. This is how you’re going to not get sick.’’ “If we were going to say, ‘Well, 1.5 is likely out of the question, let’s put it to 1.75,’ it gives people a false sense of assurance that 1.5 was not that important,” said Dr. Samaras, who helped shape U.S. climate policy from 2021 to 2024 in the White House Office of Science and Technology Policy. “It’s hugely important.” Scientists convened by the United Nations have concluded that restricting warming to 1.5 degrees instead of 2 would spare tens of millions of people from being exposed to life-threatening heat waves, water shortages and coastal flooding. It might mean the difference between a world that has coral reefs and Arctic sea ice in the summer, and one that doesn’t. Each tiny increment of additional warming, whether it’s 1.6 degrees versus 1.5, or 1.7 versus 1.6, increases the risks. “Even if the world overshoots 1.5 degrees, and the chances of this happening are increasing every day, we must keep striving” to bring emissions to zero as soon as possible, said Inger Anderson, the executive director of the United Nations Environment Program. Officially, the sun has not yet set on the 1.5 target. The Paris agreement remains in force, even as President-elect Donald J. Trump vows to withdraw the United States from it for a second time. At U.N. climate negotiations, talk of 1.5 has become more muted compared with years past. But it has hardly gone away. “With appropriate measures, 1.5 Celsius is still achievable,” Cedric Schuster, the minister of natural resources and environment for the Pacific island nation of Samoa, said at last year’s summit in Azerbaijan. Countries should “rise to the occasion with new, highly ambitious” policies, he said. To Dr. Victor of U.C. San Diego, it is strange but all too predictable that governments keep speaking this way about what appears to be an unachievable aim. “No major political leader who wants to be taken seriously on climate wants to stick their neck out and say, ‘1.5 degrees isn’t feasible. Let’s talk about more realistic goals,’” he said. Still, the world will eventually need to have that discussion, Dr. Victor said. And it’s unclear how it will go. “It could be constructive, where we start asking, ‘How much warming are we really in for? And how do we deal with that?’” he said. “Or it could look very toxic, with a bunch of political finger pointing.”
Read more » click here
2024 was the hottest year on record, breaching a critical climate goal and capping 10 years of unprecedented heat
It’s official: 2024 was the hottest year on record, breaking the previous record set in 2023 and pushing the world over a critical climate threshold, according to new data from Europe’s climate monitoring agency Copernicus. Last year was 1.6 degrees hotter than the period before humans began burning large amounts of fossil fuels, Copernicus found. It makes 2024 the first calendar year to breach the 1.5-degree limit countries agreed to avoid under the Paris climate agreement in 2015. Scientists are much more concerned about breaches over decades, rather than single years — as above that threshold humans and ecosystems may struggle to adapt — but 2024’s record “does mean we’re getting dangerously close,” said Joeri Rogelj, a climate professor at Imperial College London. The Copernicus analysis points to a slew of climate records falling last year: The planet endured its hottest day on record in July; each month from January to June was the warmest such month on record; and levels of planet-heating pollution reached unprecedented highs. Last year is part of a pattern of off-the-charts heat. Every single one of the world’s 10 hottest years happened in the last decade, according to Copernicus data. Behind these statistics lies a huge toll. “Every fraction of a degree … brings more harm to people and ecosystems,” Rogelj said. The extreme weather that swept the globe last year shows just how dangerous life in a warmer world already is. Back-to-back hurricanes in the US, fueled by ultra-warm ocean temperatures, killed hundreds of people. In Spain, more than 200 people died in catastrophic floods. Amazon rivers fell to unprecedented lows during the region’s worst drought on record and the Philippines experienced an extraordinary typhoon season, with six in just 30 days. The climate crisis played a role in all of these extreme events, according to scientific analyses. Scientists are still trying to fully understand why global heat has been so extreme for the past two years. The main driver is clear: the human-caused climate crisis, boosted by El Niño, a natural climate pattern that tends to have a warming influence, which began in 2023 and ended earlier this year. But it doesn’t explain all of the heat. Scientists have also pointed to a recent drop in shipping pollution following regulations — a win for human health, but, in a cruel twist, this type of pollution also helps cool the planet by reflecting sunlight back into space. The eruption of a huge underwater volcano in the South Pacific in 2022, which sent plumes of water vapor — a potent greenhouse gas — into the atmosphere may have also contributed. Then there are the clouds. A December study found a dearth of sun-reflecting clouds over the ocean may be another factor. Scientists believe it’s unlikely 2025 will be another record-breaking year. La Niña, a natural climate pattern that tends to have a global cooling influence, was declared Thursday. “But people shouldn’t think that’s climate change hitting pause or plateauing,” said Paulo Ceppi, a climate scientist at Imperial College London. “A small dip doesn’t change the clear upward trajectory we’re on,” he added. Scientists say the decades to come are likely to be hotter still as humans continue to burn planet-heating coal, oil and gas. “The world doesn’t need to come up with a magical solution to stop things from getting worse in 2025,” said Friederike Otto, a climate scientist at Imperial College London. ‘We know exactly what we need to do to transition away from fossil fuels.”
Read more » click here
You just lived through the hottest year on record. Again.
In 2024 temperatures reached 1.6 degrees Celsius above preindustrial levels.
This is a climate era when even the most ferocious records are bound to be broken. Scientists in Europe Friday confirmed that 2024 had been the hottest year on record — and the first to surpass a dangerous warming threshold of 1.5 degrees Celsius (2.7 degrees Fahrenheit) that nations had pledged not to cross. But even as experts described the year as unprecedented, they acknowledged that it would ultimately become just one more marker in an upward warming trajectory causing havoc on a growing scale. “As long as people keep burning fossil fuels, this will only get worse,” said Friederike Otto, who leads a scientific group, World Weather Attribution, which assesses the role of climate change in amplifying extreme weather events. In 2024, according to data from the European Union’s Copernicus Climate Change Service, temperatures reached 1.6 degrees Celsius above preindustrial levels. Aside from Australia and Antarctica, every continent experienced its warmest year on record. So too did sizable parts of the ocean. It is the second consecutive year in which the world has set a temperature record. In 2023, the arrival of El Niño — a natural phenomenon that is known to boost global temperatures — brought a jolt of warming much earlier than scientists had expected, with a temperature 1.48 degrees Celsius above preindustrial levels. Then in 2024, temperatures predictably remained elevated in the wake of the fading El Niño, and scientists are debating what other factors may have contributed to the margin of record warmth. Projections suggest that 2025 might not be as hot as the past two years but that it will probably rank in the top five warmest years on record. Despite the year-to-year fluctuations, the general trend is obvious, as is the cause: the emission of greenhouse gases, primarily from fossil fuels. Each of humanity’s 10 hottest years have come over the past decade. At the time, 2016 was seen as an unprecedented scorcher — what one climate scientist called a “wake-up call.” Just nine years later, 2016 is now looking “decidedly cool,” said Adam Scaife, the head of long-range prediction at Britain’s Met Office. In 2024, so many heat-related events caused death and damage that it was hard to keep up. It was a year in which an estimated 1,300 religious pilgrims died under 120-degree Saudi Arabian heat. It was a year when a smoke plume stretched diagonally across nearly all of wildfire-stricken South America, when heat-exhausted howler monkeys fell dead out of trees in Mexico, and when the hottest place on earth — California’s Death Valley — registered its hottest month ever. The heat also transformed the oceans. Marine heat waves, expansive blobs of unusual oceanic heat, covered parts of all ocean basins during the year, reaching extreme levels in the tropical Atlantic, North Pacific and western Indian Ocean. That fostered an atmosphere capable of holding more moisture, which in turn led to one of the year’s most pronounced patterns: intense storms and flooding. Dubai, a hub of luxury in the arid Persian Gulf desert, was hit by a year’s worth of rain in a single day, flooding highways and grounding flights. For the first time on record, four tropical cyclones formed simultaneously in the western Pacific in November — displacing hundreds of thousands of people in the Philippines. In Spain, an extreme rainfall pattern fed on unusually warm Mediterranean waters, leading to the deadliest floods in a single European country since 1967. “It was like a tsunami,” said Mario Martinez, a Valencia barbershop owner, who watched the floodwaters break through the glass windows of his shop. He escaped the rising waters by hopping on a car that had gone into the storefront, and then jumping to a second-floor balcony. “First, you’re just grateful to be alive,” said Martinez, 50. “And then you realize what has happened and how much it has ruined you.” He said the flood threw him back by “20 or 30 years.” He spent weeks in cleanup mode, and when he reopened a month later — still with mud caking the walls — his was the only remaining business on the block.
Will the heat continue?
Though the world broke the 1.5-degree Celsius threshold in 2024, that doesn’t mean the planet has formally breached the most ambitious target set in the Paris agreement. It will take a much longer span for scientists to make that determination. That’s partly because there are many variables that make some years hotter than others. One of those variables is the natural El Niño-Southern Oscillation, based on shifts in ocean trade winds, which can influence global weather patterns. During El Niño periods, sea surface temperatures across the middle of the Pacific Ocean tend to be higher than average. During La Niña periods, they tend to be cooler. Right now, cool water in the equatorial Pacific signals that La Niña has developed. But it is expected to be short-lived. New climate model projections show the cool water in the Pacific eroding and giving way to warmer-than-average seas by the middle part of 2025. Meanwhile, warmer-than-average seas are predicted to continue across most of the rest of the planet. This suggests that the planet will have little, if any, reprieve from record warmth in the months ahead — which could be exacerbated further if an El Niño develops later in the year. El Niño events are known for their warming effect, as heat that builds up along the equator spreads outward. There is some question about what drove the record warmth of 2023 and 2024, besides the emergence of a strong El Niño climate pattern. Scientists have explored contributions from a 2022 volcanic eruption that spewed water vapor into the atmosphere, a spike in solar activity sending more energy toward Earth, and reductions in air pollution around the world, which allowed more sunlight to reach the planet’s surface. They found a mix of influences. But a full understanding is still lacking, said Gavin Schmidt, director of the NASA Goddard Institute for Space Studies. That makes it more difficult to predict what trajectory temperatures could take in the years ahead, since some warming factors could be temporary, while others could continue adding to the warmth, said Nick Dunstone, a fellow at the Met Office. “It really depends what the driver is, as to what happens next,” Dunstone said.
A hidden toll
Despite the planetary alarm bells, it was a brutal year for environmental diplomacy. The right-wing shift in many countries, coupled with the victory of former president Donald Trump in the United States, widened divides over who is responsible for climate change and how to deal with it. Several end-of-year events on environmental issues either derailed or failed to make substantial progress. Saudi Arabia used its veto power to push back against the global phaseout of fossil fuels. Wealthy nations offered only a fraction of the money needed by poorer countries to handle the escalating costs of climate change. And indeed, in 2024, extreme events left the greatest toll in places least equipped to handle it. Sudan, torn apart by war, saw flooding that inundated crops and displaced scores who had already fled once because of conflict. Across Chad, Mali and Nigeria, extreme rains killed more than 1,000 and upended the lives of people such as Babakura Bukar, who fled his home when the rainfall started and then returned to it in a rented canoe. The flooding was so vast that in the aftermath, his neighborhood, in the Nigerian city of Maiduguri, resembled a lake. Bukar paddled toward his home and felt his heart drop. The outer fence of his property had collapsed. His furniture and most of his electronics were destroyed. He managed to salvage a solar panel from the rooftop. “It was a nightmare,” said Bukar, 58, a retired journalist. Even several months later, he is still living with his family in the guesthouse of a friend. He received $200 in government assistance, he said. But rebuilding his home will cost about $6,000, he estimated. “And I don’t even think I am halfway done,” he said.
Read more » click here
Previously reported – February 2025
Global Temperatures Shattered Records in January
Earth’s prolonged streak of abnormal heat continued into 2025 despite the arrival of La Niña ocean conditions, which typically bring cooler temperatures.
Even as much of the United States shivered under frigid conditions last month, the planet as a whole had its warmest January on record, scientists said on Thursday. The warmth came as something of a surprise to climate researchers. It occurred during La Niña conditions in the Pacific Ocean, which tend to lower the globe’s average temperature, at least temporarily. Earth’s surface has now been so warm for so much of the past two years that scientists are examining whether something else in the planet’s chemistry might have changed, something that is boosting temperatures beyond what carbon emissions alone can explain. Those emissions, the byproduct of burning coal, gas and oil, remain the main driver of global warming, which reached record levels in both 2023 and 2024. It’s because of La Niña that scientists expected this year to be slightly cooler than the past two years, both of which experienced the opposite pattern, El Niño. The waters of the eastern tropical Pacific oscillate between El Niño and La Niña conditions, influencing weather worldwide by changing the balance between heat in the ocean and heat in the air. But a host of other factors figure into global temperatures as well. At the moment, chances aren’t high that 2025 will end up being the hottest year on the books, Russell Vose, a climate scientist at the National Oceanic and Atmospheric Administration, told reporters recently. But this time last year, researchers were saying much the same thing about 2024, Dr. Vose said. They were wrong. “So, it’s a tough game, forecasting global temperature,” Dr. Vose said. According to Copernicus, the European Union climate monitoring agency, last month was much balmier than usual in northern Canada, Alaska and Siberia, as well as parts of Australia and Antarctica. Abnormally high temperatures above the Hudson Bay and the Labrador Sea helped shrink Arctic sea ice to a record low for January, Copernicus said. As scientists try to explain the unending streak of worldwide warmth, one thing they’ve focused on is reductions in air pollution. In a report this week, James Hansen, the famed former NASA scientist, argued that cutting pollution had already played a big role in causing global warming to accelerate. The reason is a little counterintuitive: For decades, humans have not only been emitting carbon dioxide and other greenhouse gases when they burn fossil fuels. They’ve also been spewing tiny sulfate particles into the air. These particles spur the formation of more and brighter clouds, which help shield Earth from the sun. But as regulators have curbed sulfate pollution to protect people’s lungs, this cooling effect has diminished, exposing the planet to more of the full force of greenhouse warming. Three decades ago, Dr. Hansen was among the first scientists to draw broad attention to climate change. Speaking to reporters this week, he argued that the United Nations was ill-prepared to address accelerated warming. The U.N.’s approach to meeting its climate goals still counts on societies to slash their carbon emissions in the coming decades, he said. Those goals now look “impossible” to achieve, Dr. Hansen said, “unless some miracle occurs that we don’t understand.”
Read more » click here
Previously reported – March 2025
Hottest decade
The latest “State of the Global Climate” report has been released and the news is pretty dire: our world has just experienced its hottest decade. According to the World Meteorological Organization, 2024 was the hottest since record-keeping began and was likely the first time global temperatures exceeded 1.5 degrees Celsius above the baseline set in 1850-1900. Atmospheric concentrations of carbon dioxide, methane and nitrous oxide were at the highest levels in the last 800,000 years. Such record levels of greenhouse gases — along with the El Niño weather pattern — were mostly to blame for the higher temperatures.
Earth’s 10 Hottest Years Have Been the Last 10
A report from the World Meteorological Organization confirms that 2024 was the hottest year on record and the first year to be more than 1.5 degrees Celsius above the preindustrial era.
With the addition of 2024, yet another record-hot year, the past 10 years have been the 10 hottest in nearly 200 years of record-keeping, the World Meteorological Organization reports. “That’s never happened before,” said Chris Hewitt, the director of the W.M.O.’s climate services division. It marks the first time since record keeping began that all of the 10 hottest years have fallen within the most recent decade. 2024 was the single warmest year on record, surpassing even 2023’s wide lead over other recent years. The planet’s surface was approximately 1.55 degrees Celsius warmer than its average during a reference period that approximates the preindustrial era, from 1850-1900. The annual report from the W.M.O., a United Nations agency, includes input from dozens of experts and institutions from around the world and sheds further light on the record-breaking heat of 2024 and places it in the context of Earth’s long-term warming from climate change. The extra energy in the atmosphere and the oceans helped fuel climate-related disasters around the globe. Extreme weather events like drought, storms and wildfires displaced hundreds of thousands of people from their homes, the report says. Atmospheric levels of greenhouse gases released from fossil fuel combustion continue to rise. In 2024, the concentration of carbon dioxide hit amounts unseen in at least two million years, according to the report. Concentrations of two other important greenhouse gases, methane and nitrous oxide, reached levels unseen in at least 800,000 years. Homo sapiens, or modern humans, emerged around 300,000 years ago, so our species has never before experienced an atmosphere so laden with planet-warming greenhouse gases. When countries signed the Paris Agreement in 2015, they agreed to try to limit global warming to 1.5 degrees Celsius above preindustrial levels. “While a single year above 1.5 degrees C of warming does not indicate that the long-term temperature goals of the Paris Agreement are out of reach, it is a wake-up call that we are increasing the risks to our lives, economies and to the planet,” Celeste Saulo, the secretary general of the W.M.O., said in a statement. The new report estimates that long-term warming has reached 1.25 to 1.41 degrees Celsius above preindustrial levels, although the margins of error for some estimates extend beyond 1.5 degrees. The report authors estimate that last year, El Niño and other factors contributed an additional 0.1 or 0.2 of a degree of temporary warming. El Niño is a natural climate pattern that tends to slightly raise the overall surface temperature of the planet. Record warmth, however, continued into 2025, even through El Niño’s transition into the opposing pattern, La Niña. “It’s been really quite extraordinary to see that warmth continue for so long,” John Kennedy, the scientific coordinator and lead author of the report, said during a call with reporters. This warmth is especially apparent in the oceans, where key indicators of climate change are now accelerating. The oceans have so far absorbed around 90 percent of the additional heat trapped inside Earth’s atmosphere by greenhouse gases. The oceans’ heat content — a way to measure this warmth throughout different depths — also reached a record high last year. Over the past two decades, from 2005 to 2024, the oceans warmed more than twice as fast as they did from 1960 to 2005, according to the report. Increased ocean temperatures have had devastating consequences for marine life. By April 2024, warm-water corals had been bleached in every ocean basin where they grow. Global average sea-level rise also reached a record high in 2024, according to the report. The speed at which the seas are rising has also more than doubled in recent years: 4.7 millimeters per year in the past decade, from 2015 to 2024, compared with 2.1 millimeters per year from 1993 to 2002. The World Meteorological Organization’s work depends on international cooperation among its 101 member countries, including the United States. “If you look at how weather has progressed since the initiation of the W.M.O. in 1950, you can now see that you can have the forecast on your smartphone,” said Omar Baddour, the W.M.O.’s chief of climate monitoring. “You cannot believe how much collaboration is behind this.” Data from NASA and the National Oceanic and Atmospheric Administration, which recently lost hundreds of staff positions as part of the rapid, large-scale cuts to the federal bureaucracy the Trump administration undertook beginning earlier this year, are included in the W.M.O.’s new report.
Read more » click here
Previously reported – July 2025
The World Is Warming Up. And It’s Happening Faster.
Human-caused global warming has been increasing faster and faster since the 1970s.
Summer started barely a week ago, and already the United States has been smothered in a record-breaking “heat dome.” Alaska saw its first-ever heat advisory this month. And all of this comes on the heels of 2024, the hottest calendar year in recorded history. The world is getting hotter, faster. A report published last week found that human-caused global warming is now increasing by 0.27 degrees Celsius per decade. That rate was recorded at 0.2 degrees in the 1970s and has been growing since. This doesn’t surprise scientists who have been crunching the numbers. For years, measurements have followed predictions that the rate of warming in the atmosphere would speed up. But now, patterns that have been evident in charts and graphs are starting to become a bigger part of people’s daily lives. “Each additional fractional degree of warming brings about a relatively larger increase in atmospheric extremes, like extreme downpours and severe droughts and wildfires,” said Daniel Swain, a climate scientist at the University of California. While this aligns with scientific predictions of how climate change can intensify such events, the increase in severity may feel sudden to people who experience them. “Back when we had lesser levels of warming, that relationship was a little bit less dramatic,” Dr. Swain said. “There is growing evidence that the most extreme extremes probably will increase faster and to a greater extent than we used to think was the case,” he added. Take rainfall, for example. Generally, extreme rainfall is intensifying at a rate of 7 percent with each degree Celsius of atmospheric warming. But recent studies indicate that so-called record-shattering events are increasing at double that rate, Dr. Swain said. “There is no weather that’s happening outside of climate,” said Kate Marvel, a climate scientist and author of the book “Human Nature.” “This is stuff that’s manifesting in the real world,” she said, citing catastrophes like Hurricane Helene and Vermont’s historic floods in 2023.According to Dr. Swain, scientists have yet to come to a universal understanding of these events, in part because the infrequent nature of outliers makes them difficult to study. And as warming has intensified, so have the impacts on vulnerable regions of the planet like the Arctic and Antarctic, making previously rare or hidden consequences more apparent. Scientists are fine-tuning their models to understand the behavior of the vast ice sheets in such places to match the rapid changes they’re observing. In March, a NASA analysis found that sea levels had risen faster than expected in 2024, in part because of a combination of melting glaciers and heat penetrating deeper into oceans, causing them to expand thermodynamically. Sea surface temperatures are rising faster than previously predicted, too, according to a study published in April by researchers at the National Center for Earth Observation in Britain. Cecilia Bitz, a professor of climate science at the University of Washington, said that modeling the Earth is complex, and that there are an innumerable amount of small factors that could be taken into account. But even with these uncertainties, scientists have ways of building their models to identify trends that are largely accurate. “Nothing is defying our big picture about the physics of the climate system,” Dr. Bitz said. Overall atmospheric warming has consistently followed modeling predictions for decades. But recently, the fundamental imbalance responsible for this heat has been tilting — catching even scientists off guard. Global warming is a symptom of Earth’s energy imbalance, which is a measure of the difference between the total amount of heat reaching Earth from the sun, and the amount radiating back into space. In May, a paper analyzing data from a NASA satellite found that this imbalance had grown faster than expected, more than doubling in the past two decades and becoming nearly twice as large as it was previously predicted to be. Zeke Hausfather, a research scientist at Berkeley Earth, said climate scientists were still working to understand these findings. There are various theories, such as fewer emissions of aerosols, a type of air pollution that is harmful to human health and that increases the reflectivity of clouds, which bounce the sun’s heat back into space. Historically, aerosol emissions have masked the warming effect of greenhouse gases like carbon dioxide. Over the past half-century or so, as nations reduced certain kinds of air pollution, aerosol emissions fell significantly. According to Dr. Hausfather, this change is the primary reason atmospheric warming has accelerated in recent decades. But the most worrying possibility behind Earth’s energy imbalance, he said, is how the general nature of clouds may be changing in response to climbing temperatures. It’s a feedback loop that could potentially exacerbate warming and is “one of the single biggest uncertainties in predicting future climate,” he said. As the world continues to emit planet-warming greenhouse gasses, and temperatures climb past what the human world was built to handle, Dr. Marvel said, more people will experience climate change in damaging and frightening ways. “It’s always worse than expected when it happens to you,” Dr. Marvel said. “It is one thing to see something in a climate model, and it’s a totally different thing to actually experience it in your own life.”
Read more » click here
We May Not Agree on Climate, but We All Feel the Heat
Just five days into summer, much of the United States is gripped by a record-breaking heat dome. Pavement is buckling in Wisconsin. Trains in the Northeast have had to slow or stop to avoid heat-induced “sun kinks” in the rails. Emergency rooms are expected to fill with patients with heat-related illness across the Midwest. Power grids are straining and the Washington Monument is closed to visitors. These events aren’t outliers; they are the signs of a new era of more frequent and intense heat waves that will test infrastructure, public health systems and communities. For my research on heat, I meet people from across the political spectrum who are living through these extreme heat episodes and stressing over escalating electric bills, dying livestock and dangerous working conditions. I have found that there is no need to litigate the science of climate change in these conversations. Rather, if our leaders focus on the disruptions and damage caused by heat, they can open the door to broader, more effective bipartisan solutions. Unlike hurricanes or floods, extreme heat doesn’t leave behind eye-catching wreckage. But its toll is no less profound. Exposure to heat in the workplace drags down labor productivity, suppresses local gross domestic product and hits rural economies hardest — especially those heavily dependent on manufacturing or agriculture. Supply chain disruptions and power outages that destroy inventories also drive up costs for producers and consumers, from food spoilage in grocery stores and warehouses to heat-damaged electronics and pharmaceuticals rendered unusable. The risks go beyond the economy and public health. Extreme heat is also emerging as a national security concern. It threatens the physical readiness of soldiers, weakens military installation infrastructure and complicates logistics and supply chains critical to defense operations. The Department of Defense has begun incorporating heat-related stressors into its strategic planning because of the compounding effects on personnel, equipment and mission reliability, especially in rural and remote regions. Like other sectors, the military isn’t waiting for political consensus on climate change. It’s adapting to the effects that are already here. As the costs from extreme heat mount, there is growing interest from industries and lawmakers to come up with new solutions. Congress recently formed a bipartisan Extreme Heat Caucus — proof that the issue is gaining recognition across the aisle. The focus is on responding to worker injuries, economic losses and public safety risks. That’s a promising sign that heat can unite lawmakers on urgently needed nonpartisan solutions. Imagine if our approach to heat mirrored how we prepare for hurricanes — anticipating its damage, issuing targeted alerts and deploying protective infrastructure, such as cooling centers, shaded transit stops and reflective roofing materials. A new approach should also include better emergency response systems that prioritize vulnerable populations. While the National Weather Service does issue heat alerts, they are often based on statistical thresholds (like the 95th or 98th percentile of past regional heat waves) and generally do not incorporate health outcomes. Many of the most serious health effects occur well below those statistical thresholds. As a result, alerts may come too late or not at all. More nonpartisan support for dealing with increasingly brutal summers could also mean updated alerts, as well as better workplace protections, a modernized electric grid to avoid outages and the development of smarter technologies. Business leaders are beginning to recognize the need to address extreme heat. GE Appliances recently installed sensor-driven ventilation systems to keep factory floors cooler and less humid. The result was increased employee comfort, greatly improved retention of workers and safer working conditions. In the construction industry, some firms are giving employees devices that detect early signs of heat stress, helping field supervisors respond before a medical emergency occurs. Delta Air Lines is working with the Korey Stringer Institute, a research center focused on heat and health, to develop policies to protect their ground crews, who can be exposed to very high temperatures from heat radiating off the tarmac and jet engines. United Parcel Service recently rolled out cooling hats, towels and sleeves along with water for its delivery workers and added fans and exhaust heat shields to vehicles as part of a new heat-safety agreement with the Teamsters. The insurance industry is also beginning to rethink how it responds to the rising risks of extreme heat. One emerging tool is parametric insurance, a policy that issues automatic payouts when specific temperature thresholds are met, rather than requiring damage assessments or lengthy claims processes. This kind of approach isn’t about replacing income; it’s about helping businesses, farms and independent workers absorb shocks and keep operating. The solutions are out there — we just need to scale them. Congress should support bipartisan efforts like the new Extreme Heat Caucus. Businesses should treat heat not as a seasonal inconvenience, but a year-round operational risk. And cities, states and the federal government must invest in extreme heat preparedness, not just recovery. Extreme heat is not a niche environmental issue. It determines whether construction crews can safely finish a job, whether school buildings without adequate air-conditioning can stay open and whether crops make it to market or wither in the field. If we get serious about heat, we don’t just weather the summer — we will protect workers, safeguard infrastructure and strengthen the systems that communities rely upon every day, building a more resilient economy for everyone.
Read more » click here
Previously reported – September 2025
How Climate Change Affects Hurricanes Like Erin
Global warming is changing the way storms behave.
Hurricane Erin is whipping up the Atlantic Ocean at speeds over 100 miles per hour. The trajectory of the storm has it staying out to sea, though many effects will be felt close to shore and on land. And some of those effects are made worse by global warming. Overnight on Friday, Hurricane Erin ratcheted up to a Category 5 storm, from a Category 1, becoming one of the top five most quickly intensifying hurricanes on record. As the planet warms, scientists say that rapidly intensifying hurricanes are becoming ever more likely. “It’s a very easy set of dots to connect,” said Jim Kossin, who worked at the National Oceanic and Atmospheric Administration as a hurricane specialist and climate scientist before he retired. “These rapid intensification events are linked pretty directly to that human fingerprint.” According to the National Hurricane Center, rapid intensification is an increase in a storm’s sustained wind speeds of at least 35 miles per hour in a 24-hour period. Between Friday morning and Saturday morning, Hurricane Erin’s wind speeds increased by nearly 85 miles per hour, peaking at 161 mph. Daniel Gilford, a climate scientist at Climate Central, a science communication nonprofit, likens hurricanes to the engine of a car. “They need some fuel source in order to spin, and the fuel source is the ocean surface,” he said. “So as the temperature of the ocean surface goes up, that adds more fuel that these storms can use to intensify.” For over a century, greenhouse gases emitted by human activity have trapped heat inside the planet’s atmosphere. A recent streak of record-breaking temperatures crowned 2024 as the hottest year on record. By May of 2024, super marine heat waves had turned nearly a quarter of the world’s ocean area into bath water, and this year’s Atlantic Ocean remains warmer than average. Earlier this summer, forecasters anticipated a busier than usual Atlantic hurricane season because of this lingering heat, along with other regional factors. Erin is the first named storm to become a hurricane this year. As a storm moves across warm oceans, it gathers more fuel and becomes stronger. Because warmer air can hold more moisture, hurricanes in hotter conditions can also carry more rain. According to Climate Central’s analysis of the storm, human-caused climate change made the warm water temperature around where Erin formed at least 90 times more likely. The group’s early estimate, using a statistical model developed by NOAA, also found that the extra heat could drive 50 percent greater damage, like tidal erosion and flooding, to coastal areas. Other features of storms have been exacerbated by the warming planet, too. As polar regions melt and sea levels rise, Dr. Gilford said, the rising tidal base line means that any coastal flooding from storms becomes correspondingly larger, too. During Hurricane Sandy, floods were four inches deeper than they would have been without sea level rise, according to a Climate Central paper published in the journal Nature. “That doesn’t sound like a lot, but four inches could be the difference between over topping the bottom floor of a building or not,” he said. After intensifying, Hurricane Erin grew a second larger eyewall, which is the meteorological term for the thick ring of clouds at the cyclone’s center. Hurricanes that go through an eyewall replacement cycle are larger in size but tend to have weaker wind speeds. As of Wednesday afternoon, Hurricane Erin was 530 miles wide, an expanse that would smother New England. While the storm’s strongest winds aren’t expected to reach coastlines, the powerful waves and riptides that are generated will. Faster intensification makes eyewall replacement more likely, Dr. Kossin said. “All of these behaviors are ultimately linked to the warm water that these storms are sitting on top of,” he said. “The water is warm because the planet is heating up.”
Read more » click here
Top Scientists Find Growing Evidence That Greenhouse Gases Are, in Fact, a Danger
The assessment contradicts the Trump administration’s legal arguments for relaxing pollution rules.
The nation’s leading scientific advisory body issued a major report on Wednesday detailing the strongest evidence to date that carbon dioxide, methane and other planet-warming greenhouse gases are threatening human health. The report, published by the National Academies of Sciences, Engineering, and Medicine, is significant because it could complicate the Trump administration’s efforts to revoke a landmark scientific determination, known as the endangerment finding, that underpins the federal government’s legal authority to control the pollution that is driving climate change. The finding dates to 2009, when the Environmental Protection Agency concluded that planet-warming greenhouse gases pose a threat to public health and welfare and so should be regulated under the Clean Air Act. The Obama and Biden administrations used that determination to set strict limits on greenhouse gas emissions from cars, power plants and other industrial sources of pollution. But in July, the Trump administration proposed to rescind the endangerment finding and contended that subsequent research had “cast significant doubt” on its accuracy. The proposal is one of President Trump’s most significant steps yet to derail federal climate efforts. If the move is held up in court, future administrations would have no authority under the Clean Air Act to regulate greenhouse gas emissions from the burning of fossil fuels. The new National Academies assessment contradicts the administration’s claims. The 136-page report, assembled by a committee of two dozen scientists, concludes that the original endangerment finding was accurate and “has stood the test of time.” It says that there is now even stronger evidence that rising greenhouse gas levels can threaten public health and well-being, and that new risks have been uncovered. The report notes that multiple lines of evidence now show that human activities such as the burning of fossil fuels and deforestation are producing greenhouse gases that are heating the planet, and that climate change is exacerbating a wide variety of health risks like intense heat waves and increased wildfire smoke. Climate-driven changes in temperature and rainfall patterns have also led to negative effects on crops and less water availability in some places, among other disruptions. The National Academies of Sciences, Engineering, and Medicine is a nongovernmental body that was originally chartered in 1863 by Abraham Lincoln to advise the nation on scientific and medical questions. The influential body issues roughly 200 reports per year on a range of topics from particle physics to neurobiology, and its members are elected each year. In August, the National Academies announced that it was fast-tracking its study on the endangerment finding so that it could inform the E.P.A.’s decision-making process. Under federal law, the E.P.A. needs to solicit public comment on its proposal to revoke the finding and then must respond to all of the comments it receives. Some Republicans in Congress criticized the National Academies for racing to complete the report. Representative James Comer of Kentucky, the leading Republican on the House Oversight Committee, wrote in a recent letter to the body that the decision was “a blatant partisan act to undermine the Trump Administration” and said that some of the members overseeing the report had “shown partisan bias.” The committee that oversaw the report was led by Shirley Tilghman, an emeritus professor of molecular biology and public affairs and former president of Princeton University. While the committee was largely made up of academics, it also included a former employee of Chevron and a former executive at Cummins, a manufacturer of truck engines. “This study was undertaken with the ultimate aim of informing the E.P.A., following its call for public comments, as it considers the status of the endangerment finding,” Dr. Tilghman said in a statement. “We are hopeful that the evidence summarized here shows the strong base of scientific evidence available to inform sound decision-making.” In response to the report, Carolyn Holran, an E.P.A. spokeswoman, said, “The endangerment finding has been used by the Obama and Biden administrations to justify trillions of dollars of greenhouse gas regulations covering new motor vehicles and new motor vehicle engines. As we saw in the 16 intervening years since the endangerment finding was made, many of the extremely pessimistic predictions and assumptions E.P.A. relied upon have not materialized as expected.” She said the E.P.A. “looks forward to responding to a diverse array of perspectives on this issue,” when the public comment period ends on Sept. 22. To justify its proposal, the E.P.A. cited a variety of legal and technical arguments, saying among other things that the greenhouse gas emissions from vehicles on American roads are only a small sliver of total global greenhouse gas emissions. But the agency also tried to argue with the mainstream scientific view that climate change poses a significant risk to humanity. It cited a report that the Energy Department commissioned by a working group of five prominent researchers who dissent from the mainstream scientific view of climate change. They were handpicked by Energy Secretary Chris Wright and while their report acknowledged that the Earth is warming, it said that climate change is “less damaging economically than commonly believed.” In response, a team of more than 85 scientists wrote a 439-page reply, saying that the Energy Department analysis was riddled with errors and cherry-picked data to fit the president’s political agenda. Separately, two environmental groups have filed a lawsuit in federal court charging that the formation of the Energy Department’s working group violated the Federal Advisory Committee Act and that the E.P.A. should not rely on its analysis. That case is ongoing. Mr. Wright disbanded the working group this month in the wake of the lawsuit. But the Energy Department has said it has no plans to withdraw its report. In a statement, Andrea Woods, an Energy Department spokeswoman, said that the agency had determined that the working group had achieved its purpose, “namely to catalyze broader discussion about the certainties and uncertainties of current climate science. We will continue to engage in the debate in favor of a more science-based and less ideological conversation around climate science.” Some legal experts said that the Trump administration’s attempts to argue against longstanding scientific findings on climate change could create problems in court for its deregulatory efforts. “It might have been a better strategy if they tried to sidestep the arguments about climate science altogether,” said Patrick Parenteau, an emeritus professor at the Vermont Law and Graduate School. “Instead, they’ve taken shots at climate science and that’s triggered an enormous response from scientists, and now they’re going to have to carefully respond to all of these comments,” Mr. Parenteau added. “And if they shortchange any of them, that creates a legal vulnerability. Courts are going to be very leery if the E.P.A. tries to ignore or reject the findings of the National Academies of Sciences.”
Read more » click here
Previously reported – January 2026
Climate Change Is Fueling Extremes, Both Hot and Cold
The possibility of snow in Tampa, Fla. Record heat and fires in Australia. Scientists say climate change is exacerbating weather extremes.
On a typical winter day, the Arctic air that has gripped much of the United States this week should be a few thousand miles to the north, sitting atop the North Pole. But as man-made climate change continues to disrupt global weather patterns, that mass of cold air, known as the polar vortex, is straying beyond its usual confines. The escaped polar vortex is just one instance of extreme weather playing out right now around the world. With so much cold air much farther south than usual, typically frigid regions have become relatively balmy. “While cold conditions in the U.S. have made headlines, Greenland and the Arctic have quietly had a remarkably mild winter,” wrote Ben Noll, a meteorologist at The Washington Post. Elsewhere, extreme heat is raging. Australia is reeling from a record heat wave that has pushed temperatures past 120 degrees Fahrenheit, or about 49 Celsius, in some areas, leading to fires and power outages. In central Africa, brutal heat has shattered records in recent days, with countries north of the Equator hitting temperatures above 101 degrees Fahrenheit. Colder colds. Hotter hots. These are the intense bouts of unusual weather that scientists for decades warned would become more common with global warming. “This is the thing we’ve talked about with climate change,” said Judson Jones, a Times meteorologist and reporter. “The extremes are going to be more extreme.” Around the world, climate change is making heat waves more intense, more persistent and extending heat over larger areas, said Jennifer Francis, a senior scientist at the Woodwell Climate Research Center. “On top of that, increased moisture in the atmosphere makes the heat more dangerous because sweating as a cooling mechanism doesn’t work as well,” she added. Global warming is also intensifying droughts. With a warm atmosphere holding more moisture, water is evaporating faster, drying out soils. “The combination of heat and drought is a recipe for wildland fires, which are becoming more numerous and destructive,” Francis said. And when it rains, it pours. All that additional moisture in the atmosphere is leading to an uptick in heavy precipitation events. “When a storm does form, it has more moisture to dump as rain or snow,” she said. Meanwhile, another winter storm — this one coming in from the Atlantic Ocean — is set to hit the eastern U.S. this weekend. There’s even a possibility of snow in Tampa, Fla., something that hasn’t happened in four decades.
A blast of cold air
The polar vortex is a large, rotating expanse of cold air that generally swirls over the Arctic. And it’s normally an afterthought. “The stratospheric polar vortex exists only in winter, and usually has little influence on our weather,” said Francis. “But when it is disrupted — which means instead of being strong and circular over the North Pole, it becomes weak, elongated or split,” she said, “it can bolster cold spells like the one happening over the eastern U.S. now.” Some scientists believe that one cause of the disruption of the polar vortex is melting sea ice. Less ice means that the difference in temperature between the Arctic and areas farther south is not as large. This has the effect of weakening the westward winds of the jet stream. And “when the jet stream is weaker, it tends to take bigger swings north and south,” Francis said, adding that “those southward dips are what allow the Arctic air to plunge southward.” There’s reason to believe these disruptions may become more common as the planet continues to heat up. Overall, the Arctic is warming much faster than the rest of the planet, and the polar vortex has already been disrupted a number of times this year.
The effects of extreme weather
A disrupted polar vortex may sound abstract, but the consequences are very real. The effects of the last winter storm are still being felt around the country. More than 60 people around the country died, including several in New York City who died from exposure to the cold. Around the country, tens of thousands of people were still without power days after the storm had passed. More than a foot of snow fell in 19 states, and cities including Washington were still struggling to dig out, leading much of the federal government to work remotely. And with temperatures staying low, there has been no chance for the snow and ice to thaw, putting much of the country into a sort of frozen paralysis. In Central Arkansas, many school districts remained closed for much of the week with roads impassable. Highways in Mississippi were snarled for days, leading to the National Guard being brought in to help clear the ice. And while the next storm is not expected to be as widespread as the previous one, it is poised to have crippling impacts across the already battered East Coast.
Read more » click here
Previously reported – March 2026
The Balance That Keeps Climate Stable Is Out of Whack, U.N. Report Finds
The continued burning of fossil fuels is locking heat in Earth’s atmosphere, oceans and land — instead of allowing it to reflect back into space, a new report finds.
The Earth is out of balance. That’s the message from a United Nations report released late Sunday that looked at how much energy from the sun is absorbed by the Earth or reflected back into space. Researchers found the gap between the two is the biggest since measurements began in 1960, meaning more of the sun’s heat energy is now staying on Earth. And that energy imbalance is heating up the oceans, atmosphere, and frozen regions of the world, according to the World Meteorological Organization’s State of the Global Climate report. Ashkay Deoras, a research scientist at Britain’s National Center for Atmospheric Science at the University of Reading, likened the planet to a heated room with the windows closed. “If you open the window, naturally, you will allow the hot air to escape,” said Dr. Deoras, who was not associated with the report. “But now what is happening is that, because of all these greenhouse gases, they are just trapping more and more heat. The planet is just not getting a chance to cool down.” In previous reports, the U.N.-based meteorological organization documented changes in each element of the Earth’s system, such as surface temperatures, ocean heat, melting glaciers and sea level rise. This year, the authors, who include climate scientists and meteorologists, examined shifts on a wider scale. “The energy imbalance gives you the full picture,” Karina Von Schuckmann, an author of the report and senior adviser at Mercator Ocean International, a French scientific oceanographic organization, said at a news briefing. Under a stable climate, about the same amount of energy comes in from the sun as is reflected back. Now, however, emissions of heat-trapping greenhouse gases — carbon dioxide, methane and nitrous oxide — have surged to their highest level in at least 800,000 years and have upset this equilibrium, the researchers found. The past 11 years have been the hottest since record-keeping began. Last year was either the second- or third-hottest on record, depending on which record is used, with global average temperatures 1.43 degrees Celsius (2.5 degrees Fahrenheit) higher than preindustrial levels. The year 2024 was the hottest year, at 1.55 degrees Celsius above the preindustrial average. The world’s oceans continue to warm as they absorb carbon dioxide from the atmosphere. The extent of sea ice in the Arctic region is at or near a record low, while Antarctic sea ice extent was the third lowest on record, according to the report. Describing the energy imbalance allows scientists to assess the rate of global warming because it encompasses all the components of the climate system. “Sometimes independent graphs are not explaining the full narrative,” said Ko Barrett, deputy secretary-general of the W.M.O. and a former U.S. climate official during the Biden administration. The surplus energy that the Earth retains gets moved around from ocean to atmosphere to land. The increase in heat within the climate system raises the likelihood and intensity of extreme weather events such as powerful storms, heat waves, droughts and extreme rainfall. About 91 percent of the Earth’s surplus heat energy is stored in the oceans; 5 percent is stored in land, 3 percent in ice sheets, and 1 percent is stored in the atmosphere near the Earth’s surface — where it affects the temperatures that humans feel, the report said. The amount of heat stored in the oceans reached a record high in 2025. The rate of ocean warming more than doubled from the period between 1960 and 2005 to the period between 2005 and 2025, the report stated. One worrying result is that scientists are detecting more heat deeper in the ocean, rather than just at the surface, according to Dr. Von Schuckmann. Below 2,000 meters, oceans store and hold heat longer than at the surface layer, which releases it to the atmosphere. That means that the effects of climate change will continue for a long time, she said. “The more we have heat kept away from communication with the atmosphere,” Dr. Von Schuckmann said, “the more we are moving to time scales of committed climate change of 400 to 1,000 years.”
Read more » click here
Previously reported – June 2026
Why a notably warm start to the year foreshadows what’s ahead
See the odds for global temperature records this year and next.
It’s been a particularly toasty start to the year on planet Earth — and it may be a sign of the kind of temperature extremes coming in the year ahead. So far this year, over 70 percent of the globe has experienced well above average temperatures. Of that area, 8 percent has seen record-breaking warmth, including parts of the western United States, Asia and the Arctic. Meanwhile, just about 1 percent of the planet has experienced well below average temperatures. This significant imbalance has occurred despite one of the coldest winters in decades along the East Coast, where temperatures so far this year have balanced out closer to average from Boston to Miami. It has been particularly chilly in Alaska and northern Canada. But that has been the exception, not the rule. And that imbalance may grow more extreme in the next year, with growing potential for a now-official El Niño to become the strongest such event on record later this year. Not only would that etch a new page in the weather history books for record-breaking Pacific Ocean temperatures, but it could drive high temperature extremes that millions or even billions of people feel into 2027. Strong El Niño periods often appear as an upward stairstep in long-term plots of global temperatures — but this El Niño could be worth two stairsteps instead of one. And that has forecasters concerned about the weather extremes that the next year will probably bring. However, shifts between La Niña and El Niño, as well as other natural climate variations, don’t tell the whole story. Record or near-record high levels of ocean heat in the West Pacific — which are fueling the developing El Niño — are linked to the long-term tailwind of rising global temperatures. And that shows how climate change is amplifying the developing El Niño, with the combined influence of both natural and human-driven factors producing more warming than either would alone.
How hot could the next year get?
Climate scientist Zeke Hausfather created a dashboard that tracks global climate anomalies and projected global temperature rankings, which consider the planet’s long-term warming trend and an increasingly likely super El Niño this year into next. According to his data, which extends back to 1850, this year has about a 54 percent chance of becoming the second-warmest year on record and a 31 percent chance of becoming the warmest year and surpassing 2024. That year had a global temperature anomaly of 1.6 degrees Celsius above average (2.9 degrees Fahrenheit). However, 2027 has even higher odds of becoming the warmest year on record: The latest projections show nearly an 83 percent chance. That’s partly because increasing air temperatures from El Niño lag slightly behind increasing ocean temperatures. Although peak ocean temperatures from El Niño will probably occur around December of this year, air temperatures will continue to rise after that. Annual to decadal projections recently released by the World Meteorological Organization (WMO) echo Hausfather’s projection, predicting an 86 percent chance that at least one year from 2026 to 2030 will be warmer than the warmest year in 2024. Described as “exceptionally unlikely” by the WMO, there’s less than a 1 percent chance that global temperatures reach more than 2 degrees Celsius (3.6 degrees Fahrenheit) above average during at least one year in the next five. The report also highlighted that the Arctic is likely to continue to warm, with temperature anomalies there predicted to be three and a half times the average across the whole planet — contributing to further reductions in sea ice concentrations. Because of this, there will be “increasing climate risks and impacts on societies, economies and sustainable development,” the organization said.
Read more » click here
U.N. warns of potentially strong El Niño soon ‘arriving on our doorstep’\
The agency estimates an 80 percent chance of an El Niño event between June and August, and a 90 percent chance of it continuing until at least November.
The United Nations weather agency is urging the planet to prepare for El Niño, a burgeoning weather pattern expected to develop later this year. What begins as a warming swath of water temperatures in the eastern tropical Pacific, El Niño shifts global weather patterns in a chain-reaction process. Those cascading atmospheric influences have tangible impacts around the world. “El Niño is arriving on our doorstep in the coming months with 90 percent certainty,” U.N. Secretary General António Guterres said in the World Meteorological Organization statement, warning that the climate pattern could mean that weather impacts will “hit even harder, travel even farther.” For months, numerous climate models have predicted that a particularly strong El Niño could drive global temperatures to new highs and shift patterns of droughts, floods, heat, humidity and sea ice across the planet. El Niño is the opposite of La Niña. The two make up the El Niño Southern Oscillation (ENSO), which is like a pendulum, swinging back and forth every two to seven years. But there’s concern the upcoming El Niño may be stronger than average, leading to more significant global effects. “Although some uncertainty remains about El Niño peak strength and timing, most forecast models suggest it will be at least moderate — and possibly strong,” wrote the World Meteorological Organization. The agency estimates an 80 percent chance of an El Niño event between June and August, and a 90 percent chance of it continuing until at least November. U.S. forecasters concur: Meteorologists at NOAA’s Climate Prediction Center have issued an El Niño watch and say there’s a 96 percent chance of El Niño peaking between December and February.
What will this mean for the planet?
In its warning, WMO’s Secretary General Celeste Saulo noted the “need to prepare for a potentially strong El Niño event — which will exacerbate drought and heavy rainfall and increase the risk of heatwaves both on land and in the ocean.” The WMO noted the chance for “above average temperatures forecast nearly everywhere for June to August.” El Niños tend to raise global temperatures; added atop an already warming planet, there’s a chance that 2027 could be among the hottest years on record. Apropos to actual weather impacts, there’s good news and bad news depending on where you live. The warmer Pacific will warm the air above, leading to rising motion. That could cause more Pacific hurricanes. On the flip side, air sinks over the relatively cooler Atlantic, squashing some attempts at tropical development and reducing the number of hurricanes. That’s why El Niño events are correlated with less-severe hurricane seasons in the United States. Easterly trade winds across the equator, meanwhile, are replaced by bursts of westerly surface winds. Those pile warm waters against the western shores of South America. That suppresses cool ocean upwelling from below, which is needed to bring nutrient-rich waters closer to the surface. That starves baitfish and means poor fish harvests for dependent countries in Central America and the Pacific coast of South America. Drought, meanwhile, is likely in southern Africa, Australia, India, the Indochina peninsula and Oceania. Southeast Asia, meanwhile, could see above-average rainfall and more flooding. And stateside, the U.S. is expecting a stronger, straighter west-to-east wintertime jet stream over the southern part of the country. That will mean wetter conditions and more severe weather along the Gulf Coast, but drier and warmer conditions to the north. That could lead to a less intense winter across northern parts of the Lower 48.
Read more » click here
NOAA Officially Declares El Niño Is Here and Flashing Danger Signs
The global weather pattern threatens to worsen floods and heat waves already intensifying due to climate change. But it may also mean fewer hurricanes.
Meteorologists said Thursday that an El Niño has formed in the tropical Pacific and will likely intensify in the coming months, setting off more extreme weather and higher temperatures around the world. El Niño is the name given to a natural phenomenon that occurs every few years when trade winds shift and the Pacific Ocean warms. It affects weather patterns globally and has the potential to supercharge floods and droughts that are already worsening because of climate change. Thursday’s declaration by the National Oceanic and Atmospheric Administration means that, technically speaking, temperatures in the equatorial Pacific have held at 0.5 degree Celsius (0.9 degree Fahrenheit) above the longer-term average for several months, and that scientists have observed atmospheric shifts conducive for an El Niño. NOAA said there is a 63 percent chance of the sea-surface temperatures climbing 2 degrees Celsius above the norm, making for a “very strong” event. Many forecasts also suggest this year’s El Niño could reach even higher, beyond 3 degrees Celsius, which would be the largest on record. “We don’t really have an analog for that,” said Malte Stuecker, the director of the International Pacific Research Center and an associate professor of oceanography at the University of Hawaii at Manoa. “In a warming world, which would be pretty catastrophic.” El Niño events typically reach their peak strength during winter in the northern hemisphere and cause higher temperatures globally into the following year. The previous El Niño, in 2023 and 2024, coincided with the two hottest years on record. Previous major El Niños have also taken a vast economic toll globally. Though no two events are alike, they raise the likelihood of wet conditions in some parts of the Americas and tend to cause dryness in South and Southeast Asia, Australia, and southern Africa. For the United States, an El Niño can have an upside, suppressing hurricane season in the Atlantic. On Thursday, Colorado State University, one of the major hurricane forecasters, scaled back earlier predictions for the Atlantic season and is now calling for the lowest activity levels since 2015. But NOAA said that El Niño events can also raise the risk of high tide flooding and algae blooms along the West Coast. Globally, poorer countries are vulnerable to food shocks and droughts, a risk intensified by preexisting vulnerabilities. This year, those include fertilizer shortages stemming from the effective closure of the Strait of Hormuz, as well as a cutbacks in funding for humanitarian assistance from the United States and others. An El Niño means “failed rains, dying crops, rising food prices and families pushed to the edge yet again,” said Mohamed Adow, the director of the Nairobi-based climate and energy think tank Power Shift. “In East Africa, especially, this will land on communities already battered by droughts and floods in recent years.”
Read more » click here
A Powerful El Niño Is Forming. If History Is a Guide, It Could Hit Hard.
The biggest episodes of the past have altered the course of human events, according to researchers. An emerging one is drawing historic comparisons.
Well before it was understood, the El Niño phenomenon was leaving its marks on humanity. El Niño is the name given to powerful shifts in Pacific Ocean winds and water temperatures that can drastically transform global weather patterns. Over the centuries these natural patterns have sparked epic droughts and heat waves and have intensified epidemics. Some academics even claim to see the fingerprints of El Niño on political and economic crises in ancient Egypt, or on the downfall of the Moche civilization in present-day Peru, more than 1,000 years ago. And in 1877 and 1878, a famine fueled by El Niño killed millions of people across the tropics, hardening inequities that, as one research paper put it, “would later be characterized as the ‘first world’ and ‘third world.’” Right now, the world is entering a new El Niño phase. Researchers are warning it could be one of the strongest on record and are invoking this history as an admonition that natural forces, when they reach their highest magnitude, can lead to profound volatility and hardship. In general, El Niño makes for wetter conditions in some parts of the Americas while suppressing the Atlantic hurricane season. The phenomenon raises the risk of dryness in South and Southeast Asia, Australia, and southern Africa. Of course, the current El Niño is in the early stages of formation and might not live up to the hype. But if the forecasts prove accurate, it would be a whopper and its consequences would play out across a world that has grown far more resilient but also has new vulnerabilities. Compared with those early times, countries today track El Niño events with oceanic gauges and early warning systems. Agriculture is far more sophisticated, and many countries vulnerable to food shocks hold strategic grain reserves. Nobody is predicting large-scale famine. But experts say an El Niño would add pressure to an already precarious global system. Fertilizer shortages caused by the effective closure of the Strait of Hormuz are straining farmers. Rising energy prices resulting from war in Ukraine and Iran are eating into countries’ budgets. And a longstanding safety net has been weakened by cuts in foreign aid to poorer countries by the United States and other nations. There’s possibility for “a perfect storm of factors,” said Laurie Laybourn, who leads the Strategic Climate Risks Initiative, a think tank based in Britain. “You could see an increase in poverty, malnutrition, conflict, indebtedness, and all of the domino effects that come from that.” If history offers any lesson, it’s that strong El Niño events, like the one that started in 1877, play upon existing weaknesses. That El Niño led to punishingly dry conditions that spanned the world, including Brazil, southern Africa and China. Few places were hit harder than southern India. Contemporaneous accounts describe stick-thin people trying to survive on roots and even selling off children they couldn’t afford to care for. But for all the power of nature, man-made factors very likely raised the death toll, which ultimately rose to tens of millions of people. At the time, India was under British colonial rule, and the historian Mike Davis, in his 2001 book “Late Victorian Holocausts,” portrays Britain as prioritizing its imperial interests by maintaining huge grain exports from India even as Indians starved. “Londoners were in effect eating India’s bread,” Mr. Davis wrote. Of course, there was another factor complicating the response. People at the time had no idea why the monsoon rains had failed. Scientists in the 19th century theorized a link with weakened sunspot activity. But a far better picture emerged in the 1960s, when Jacob Bjerknes, a meteorologist at the University of California, Los Angeles, pieced together the global consequences of the feedback between the ocean and atmosphere in the Pacific. Centuries earlier, Peruvians had noticed that sometimes tropical fish would unexpectedly show up on their shores around Christmas, a phenomenon eventually named “El Niño,” or “the Christ child” in Spanish. Dr. Bjerknes made the connection: The Pacific warming that the Peruvians had spotted was, in fact, altering weather patterns around the world. “That was the big bang” realization, said Michael McPhaden, a senior scientist at the National Oceanic and Atmospheric Administration. “He opened up a new universe of study.” By the 1980s, scientists were on a vessel in the middle of the Pacific, anchoring buoys that enabled improved monitoring of ocean temperature. Separately, researchers sought out clues for El Niño’s place in human history, studying tree ring samples, coral reefs and sailors’ logbooks, and creating a crude timeline of its spikes. The records weren’t sharp enough to measure past events with certainty. But they have led to speculation about the role of El Niño events across history, including that an El Niño in the late 1700s might have played a role in the crop failures that contributed to uprisings in the French Revolution. For the 1877 El Niño, the one that hit India so hard, the documentation is better but still involves guesswork. “Working with nineteenth-century sea surface temperature data is a bit like assembling a puzzle with many missing pieces,” Boyin Huang, a NOAA oceanographer who has studied the scale of the event, wrote in an email. El Niño events are measured by looking at temperature levels in a vast rectangular zone in the central Pacific. In a moderate El Niño, temperatures might climb, say, 1 degree Celsius, or 1.8 degrees Fahrenheit, above a longer-term average. But in the biggest El Niños of the past 50 years — the ones that started in 1982, 1997, and 2015 — temperatures have soared 2 degrees Celsius or more beyond the norm. Each of those events levied a global economic toll. This year, many forecasts say the temperature could increase by an unprecedented 3 degrees Celsius. Even the 1877 El Niño, by the best estimates, didn’t have that magnitude. “A number of the models now show a real chance for a record-setting El Niño event,” said Zeke Hausfather, a research scientist at Berkeley Earth. “It is still too early to know for sure.” El Niño events typically peak in strength late in a calendar year and then cause warmer global temperatures on land in the months that follow. As a result, many scientists predict that 2027 will be the warmest year on record. In India, which tends to be drier during El Niño periods, the government has already held preparatory meetings. Vimal Mishra, a professor at the Indian Institute of Technology Gandhinagar, said his country did not face risks on the same scale as it did more than a century ago. “If one year the monsoon fails, we won’t see famine,” he said. He cited India’s public distribution system, which guarantees access to basic staples at subsidized prices. But Dr. Mishra said India, like other countries, still faced risk. If there is very little rainfall, people will draw down on savings. They’ll spend less. They’ll close down businesses. During droughts, school dropout rates rise. “It has a direct impact on the growth rate of India’s economy,” he said. Dr. Mishra has studied India’s major famines and he draws a direct line between the one from the 1870s and the preparations India is now taking. “It gives us an idea of how to be better prepared,” he said. “It shows you, this is the worst that could happen.”
Read more » click here


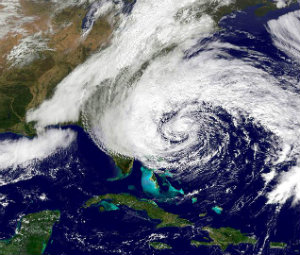
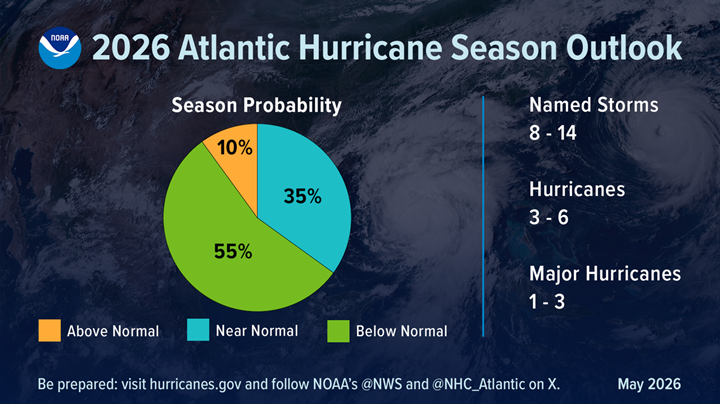


 The
The